
Transcribed Image Text
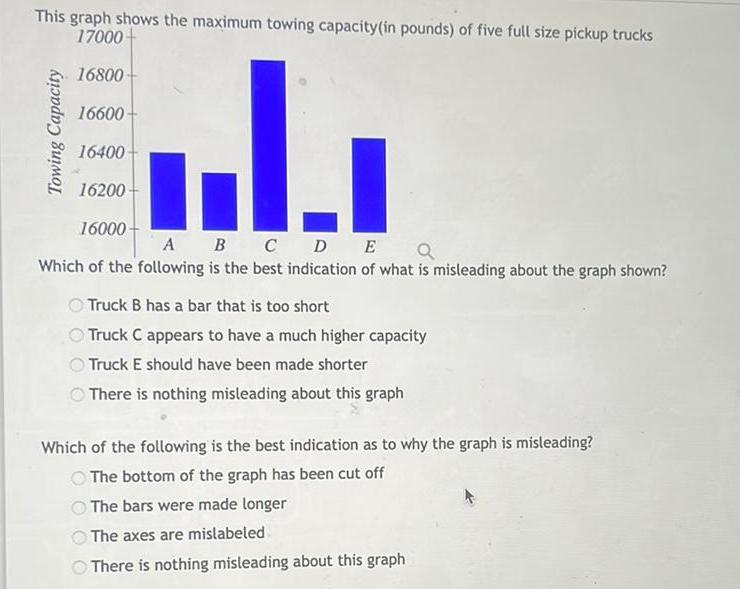
This graph shows the maximum towing capacity in pounds of five full size pickup trucks 17000 16800 16600 16400 16200 L 16000 A B C D E Q Which of the following is the best indication of what is misleading about the graph shown Towing Capacity Truck B has a bar that is too short Truck C appears to have a much higher capacity Truck E should have been made shorter There is nothing misleading about this graph Which of the following is the best indication as to why the graph is misleading The bottom of the graph has been cut off The bars were made longer The axes are mislabeled There is nothing misleading about this graph