New Pharma is a pharmaceutical company that produces and sells generic bulk drugs and formulations....
80.2K
Verified Solution
Link Copied!
Question
Accounting
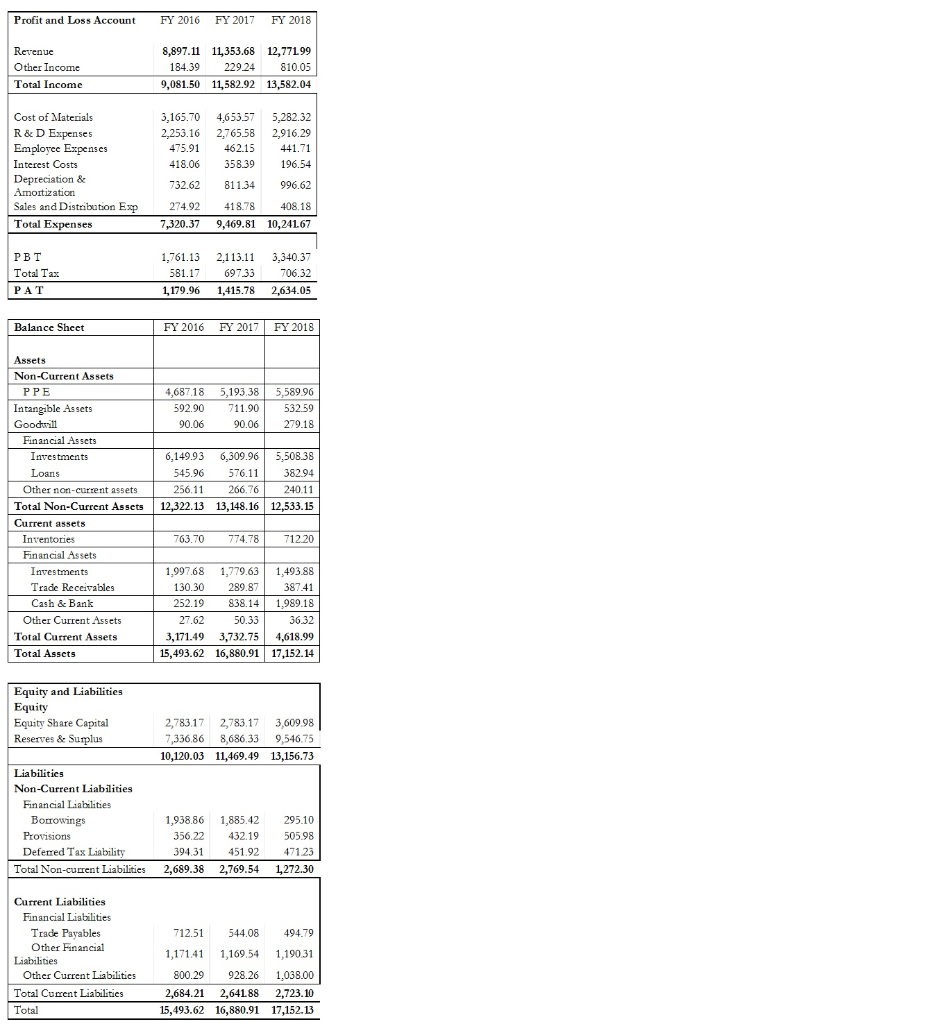
New Pharma is a pharmaceutical company that produces and sells generic bulk drugs and formulations. An analyst wants to compare the performance of New Pharma with its competitors. For New Pharma detailed financial statements for last three years are provided below. Analyse the information and answer the questions below. Your answers should involve detailed calculations and explanations.
Given the following industry average of cost of materials and R & D expenses to sales for last three years, how does New Pharma compare on these ratios?
Industry Average: % to Sales
FY 2016
FY 2017
FY 2018
Cost of Materials
36.12%
38.57%
45.67%
R & D Expenses
21.22%
19.25%
22.41%
Calculate and comment on trend in ROCE for New Pharma for last two years.
Average collection period for the industry for last two years is as follows. How does the companys average collection period compare with that of the industry?
FY 2016
FY 2017
34.22
30.47
Calculate cash generated from operations for FY 2018. For working capital changes only consider change in inventory, trade receivables and trade payables.
Calculate and comment on interest coverage ratio and debt to equity ratio for last three years.
Profit and Loss Account FY 2016 FY 2017 FY 2018 Revenue Other Income Total Income 8,897.11 11,353.68 12,771.99 184.39 229.24 810.05 9,081.50 11,582.92 13,582.04 3,165.70 4,653.57 2,253.16 2,765,58 475.91 462.15 418.06 358.39 5,282.32 2,916.29 441.71 196.54 Cost of Materials R & D Expenses Employee Expenses Interest Costs Depreciation & Amortization Sales and Distribution Esp Total Expenses 732.62 811.34 996.62 274.92 7,320.37 418.78 408.18 9,469.81 10,24167 PBT Total Tax PAT 1,761.13 581.17 1,179.96 2.113.11 3,340.37 69733 706.32 1,415.78 2,634.05 Balance Sheet FY 2016 FY 2017 FY 2018 4 687.18 592.90 90.06 5,193.38 711.90 90.06 5,589.96 532.59 279.18 Assets Non-Current Assets PPE Intangible Assets Goodwill Financial Assets Investments Loans Other non-current assets Total Non-Current Assets Current assets Inventories Financial Assets Investments Trade Receivables Cash & Bank Other Current Assets Total Current Assets Total Assets 6,149.93 6,309.96 5,508.38 545.96 576.11 382.94 256.11 266.76 240.11 12,322.13 13,148.16 12,533.15 763.70 774.78 712.20 1.997.68 1,779.63 1,493.88 130.30 289.87 387.41 252.19 838.14 1.989.18 27.62 50.33 36.32 3,171.49 3,732.75 4,618.99 15,493.62 16,880.91 17,152.14 Equity and Liabilities Equity Equity Share Capital Reserves & Surplus 2,783.17 2,783.17 3,60998 7,336,86 8,686,33 9,546.75 10,120.03 11,469.49 13,156.73 Liabilities Non-Current Liabilities Financial Liabilities Borrowings Provisions Deferred Tax Liability Total Non-current Liabilities 1,938.86 1,885.42 356.22 432.19 394.31 451.92 2,689.38 2,769.54 295.10 505.98 471.23 1,272.30 Current Liabilities Financial Liabilities Trade Payables Other Financial Liabilities Other Current Liabilities Total Curent Liabilities Total 712.51 544.08 494.79 1,171.41 1,169.54 1,190.31 800.29 928.26 1,038.00 2,684.21 2,64188 2,723.10 15,493.62 16,880.91 17,152.13 Profit and Loss Account FY 2016 FY 2017 FY 2018 Revenue Other Income Total Income 8,897.11 11,353.68 12,771.99 184.39 229.24 810.05 9,081.50 11,582.92 13,582.04 3,165.70 4,653.57 2,253.16 2,765,58 475.91 462.15 418.06 358.39 5,282.32 2,916.29 441.71 196.54 Cost of Materials R & D Expenses Employee Expenses Interest Costs Depreciation & Amortization Sales and Distribution Esp Total Expenses 732.62 811.34 996.62 274.92 7,320.37 418.78 408.18 9,469.81 10,24167 PBT Total Tax PAT 1,761.13 581.17 1,179.96 2.113.11 3,340.37 69733 706.32 1,415.78 2,634.05 Balance Sheet FY 2016 FY 2017 FY 2018 4 687.18 592.90 90.06 5,193.38 711.90 90.06 5,589.96 532.59 279.18 Assets Non-Current Assets PPE Intangible Assets Goodwill Financial Assets Investments Loans Other non-current assets Total Non-Current Assets Current assets Inventories Financial Assets Investments Trade Receivables Cash & Bank Other Current Assets Total Current Assets Total Assets 6,149.93 6,309.96 5,508.38 545.96 576.11 382.94 256.11 266.76 240.11 12,322.13 13,148.16 12,533.15 763.70 774.78 712.20 1.997.68 1,779.63 1,493.88 130.30 289.87 387.41 252.19 838.14 1.989.18 27.62 50.33 36.32 3,171.49 3,732.75 4,618.99 15,493.62 16,880.91 17,152.14 Equity and Liabilities Equity Equity Share Capital Reserves & Surplus 2,783.17 2,783.17 3,60998 7,336,86 8,686,33 9,546.75 10,120.03 11,469.49 13,156.73 Liabilities Non-Current Liabilities Financial Liabilities Borrowings Provisions Deferred Tax Liability Total Non-current Liabilities 1,938.86 1,885.42 356.22 432.19 394.31 451.92 2,689.38 2,769.54 295.10 505.98 471.23 1,272.30 Current Liabilities Financial Liabilities Trade Payables Other Financial Liabilities Other Current Liabilities Total Curent Liabilities Total 712.51 544.08 494.79 1,171.41 1,169.54 1,190.31 800.29 928.26 1,038.00 2,684.21 2,64188 2,723.10 15,493.62 16,880.91 17,152.13
Answer & Explanation
Solved by verified expert
Get Answers to Unlimited Questions
Join us to gain access to millions of questions and expert answers. Enjoy exclusive benefits tailored just for you!
Membership Benefits:
Unlimited Question Access with detailed Answers
Zin AI - 3 Million Words
10 Dall-E 3 Images
20 Plot Generations
Conversation with Dialogue Memory
No Ads, Ever!
Access to Our Best AI Platform: Zin AI - Your personal assistant for all your inquiries!