70.2K
Verified Solution
 Link Copied!


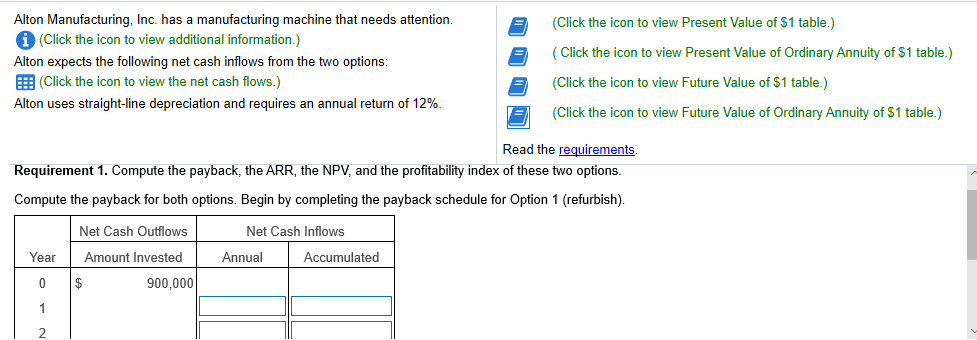

A More Info The company is considering two options. Option 1 is to refurbish the current machine at a cost of $900,000. If refurbished, Alton expects the machine to last another eight years and then have no residual value. Option 2 is to replace the machine at a cost of $2,100,000. A new machine would last 10 years and have no residual value. Print Done A Data Table Machine Machine 1 $ 620,000 $ 250,000 200,000 1,920,000 370,000 320,000 150,000 270,000 100,000 100,000 100,000 100,000 220,000 220,000 220,000 220,000 220,000 220,000 4,200,000 Total 1,620,000 $ Print Done X A Reference Present Value of $1 Periods 1% | 0.990 | 0.980 0.971 0.961 0.951 2% 0.980 0.961 0.942 0.924 0.906 7% 0.935 0.873 0.816 0.763 0.713 8% 0.926 0.857 0.794 | 0.735 0.681 16% 0.862 0.743 0.641 0.552 0.476 18% 20% 0.847 0.833 0.7180.694 0.609 0.516 0.482 0.437 0.402 0.579 3% 0.971 0.943 0.915 0.888 0.863 0.837 0.813 0.789 0.766 0.744 0.722 0.701 0.681 0.661 0.642 0.942 | 0.888 0.933 0.871 0.853 | 0.914 0.837 0.905 0.820 | 0.896 | 0.804 0.887 0.788 0.879 0.773 | 0.870 0.758 0.861 0.743 4% 0.962 0.925 0.889 0.855 0.822 0.790 0.760 0.731 0.703 0.676 0.650 0.625 0.601 0.577 0.555 5% 0.952 0.907 0.864 0.823 0.784 0.746 0.711 0.677 0.645 0.614 0.585 0.557 0.530 0.505 0.481 6% 0.943 0.890 0.840 0.792 0.747 0.705 0.665 0.627 0.592 | 0.558 0.527 0.497 0.469 0.442 0.417 0.666 0.623 0.582 0.544 0.508 | 0.475 | 0.444 0.415 0.388 0.362 9% 10% 12% 0.917 0.909 0.893 0.842 0.826 0.797 0.772 0.751 0.712 0.708 0.683 0.636 0.650 0.621 0.567 0.596 | 0.564 0.507 0.547 0.513 0.452 0.502 0.467 0.404 0.460 0.424 | 0.361 0.422 0.386 0.322 0.388 0.350 0.287 0.356 0.319 0.257 0.326 0.290 0.229 0.299 0.263 0.205 0.275 0.239 0.183 0.630 0.583 0.540 | 0.500 | 0.463 0.429 0.397 0.368 0.340 0.315 0.923 14% 0.877 0.769 0.675 0.592 0.519 0.456 0.400 0.351 0.308 0.270 0.237 0.208 0.182 0.160 0.140 15% 0.870 0.756 0.658 0.572 0.497 0.432 0.376 0.327 0.284 0.247 0.215 0.187 0.163 0.141 0.123 0.410 0.354 0.305 0.263 0.227 0.195 0.168 0.145 0.125 0.108 0.370 0.335 0.314 0.279 0.266 | 0.233 0.225 0.194 0.191 0.162 0.162 0.135 0.137 0.112 0.116 0.093 0.099 0.078 0.084 0.065 Print Done A Reference Periods 1% 2% 0.990 0.980 1.970 1.942 2.9412.884 3.902 3.808 4.853 4.713 4% 0.962 1.886 2.775 3.630 4.452 5% 0.952 1.859 2.723 3.546 4 329 12% 14% 0.893 0.877 1.6901.647 2.402 2.322 3.037 2.914 3.605 3.433 15% 0.870 1.626 2.283 2.855 3.352 Ocovo AWN- 5.795 5.601 6.728 6.472 7.652 7.325 8.566 8.162 9.471 8.983 10.368 9.787 11.255 10.575 12.134 11.348 13.004 12.106 3% 0.971 1.913 2.829 3.717 4.580 5.417 6.230 7.020 7.786 8.530 9.253 9.954 10.635 11.296 5.242 6.002 6.733 7.435 8.111 8.760 9.385 9.986 10.563 5.076 5.786 6.463 7.108 7.722 Present Value of Ordinary Annuity of $1 6% 7% 8% 9% 10% 0.943 0.935 0.926 0.917 0.909 1.833 1.808 1.783 1.759 1.736 2.673 2.624 2.577 2.531 2.487 3.465 3.387 3.312 3.240 3.170 4.212 | 4.100 | 3.993 3.890 3.791 4.917 4.767 | 4.623 4.486 4.355 5.582 5.389 5.206 5.033 4.868 6.210 5.971 5.747 5.535 5.335 6.802 6.515 6.247 5.995 5.759 7.360 6.710 6.418 6.145 7.887 7.499 | 7.139 6.805 6.495 8.384 7.943 7.536 7.161 6.814 8.853 8.358 | 7.904 7.487 7.103 9.295 8.745 8.244 7.786 7.367 4.111 4.564 4.968 5.328 5.650 5.938 6.194 3.889 4.288 | 4.639 | 4.946 5.216 5.453 5.660 5.842 6.002 16% 0.862 1.605 2.246 2.798 3.274 3.685 4.039 4.344 4.607 4.833 5.029 5.197 5.342 5.468 3.784 4.160 4.487 4.772 5.019 5.234 5.421 5.583 5.724 7.024 18% 20% 0.847 0.833 1.566 1.528 2.174 | 2.106 2.690 2.589 3.127 | 2.991 3.498 3.326 3.812 3.605 4.078 3.837 4.303 4.031 4.494 4.192 4.656 4.327 4.793 4.439 4.910 | 4.533 5.008 4.611 8.306 8.863 9.394 9.899 6.424 6.628 Print Done - X i Reference Periods 1% 2% 1.000 1.000 2.010 2020 3.0303.060 4.060 4.122 5.101 5.204 3% 1.000 2.030 | 3.091 | 4.184 5.309 14% 1.000 2.140 3.440 4.921 6.610 15% 1.000 2.150 3.473 4.993 6.742 12% 1.000 2.120 3.374 4.779 6.353 8.115 10.09 12.30 14.78 17.55 20.65 Future Value of Ordinary Annuity of $1 4% 5% 6% 7% 8% 9% 10% 1.000 1.000 1.000 1.000 1.000 1.000 1.000 2.040 | 2.050 2.060 2.070 2.080 | 2.090 2.100 3.122 3.153 3.1843.215 3.246 3.278 3.310 4.246 4.310 4.375 4.440 4.506 4.573 4.641 5.416 5.526 5637 5.751 5.867 5.985 6.105 6.633 6.802 6.975 | 7.153 7.336 7.523 7.716 7.898 8.142 8.394 8.654 8.923 9.200 9.487 9.214 9.549 9.897 10.260 10.64 11.03 11.44 10.58 11.03 11.49 | 11.98 12.49 13.02 13.58 12.01 12.58 13.18 13.82 14.49 15.1915.94 13.49 14.21 14.97 15.78 16.65 17.56 18.53 15.92 16.87 17.89 18.98 20.14 21.38 16.63 17.71 18.88 20.14 21.50 22.95 24.52 18.29 19.60 21.02 22.55 24.21 26.02 27.98 6.468 | 7.662 8.892 10.16 11.46 6.152 6.308 7.214 7.434 8.286 8.583 9.369 9.755 10.46 10.95 11.57 12.17 12.68 13.41 13.81 14.68 14.95 | 15.97 8.754 11.07 13.73 16.79 8.536 10.73 13.23 16.09 19.34 23.04 27.27 32.09 37.58 12.81 14.19 15.62 17.09 15.03 28.03 32.39 29.00 34.35 40.50 Print Done (Click the icon to view Present Value of $1 table.) Alton Manufacturing, Inc. has a manufacturing machine that needs attention. (Click the icon to view additional information.) Alton expects the following net cash inflows from the two options: (Click the icon to view the net cash flows.) Alton uses straight-line depreciation and requires an annual return of 12%. E = (Click the icon to view Present Value of Ordinary Annuity of $1 table.) (Click the icon to view Future Value of $1 table.) (Click the icon to view Future Value of Ordinary Annuity of $1 table.) Read the requirements. Requirement 1. Compute the payback, the ARR, the NPV, and the profitability index of these two options. Compute the payback for both options. Begin by completing the payback schedule for Option 1 (refurbish). Net Cash Outflows Net Cash Inflows Year Amount Invested Annual Accumulated 900,000 Enter any number in the edit fields and then click Check Answer. A parts O remaining
Answer & Explanation
Solved by verified expert
