Yume International is the New Zealand largest food & beverage wholesaler to cafes and convenience...
60.1K
Verified Solution
Link Copied!
Question
Accounting
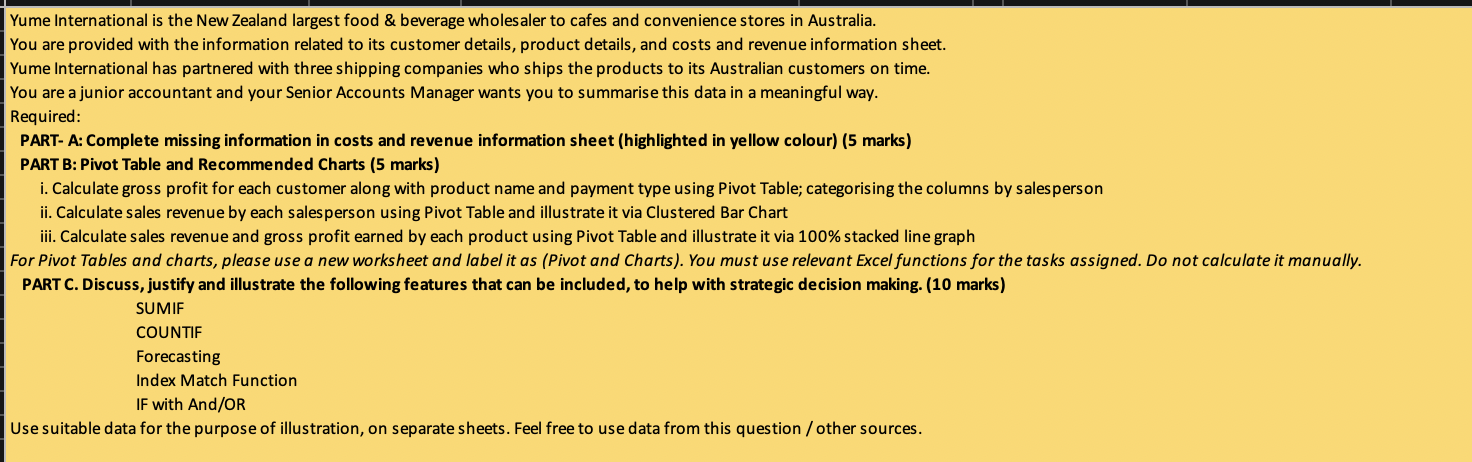
Yume International is the New Zealand largest food & beverage wholesaler to cafes and convenience stores in Australia. You are provided with the information related to its customer details, product details, and costs and revenue information sheet. Yume International has partnered with three shipping companies who ships the products to its Australian customers on time. You are a junior accountant and your Senior Accounts Manager wants you to summarise this data in a meaningful way. Required: PART- A: Complete missing information in costs and revenue information sheet (highlighted in yellow colour) (5 marks) PART B: Pivot Table and Recommended Charts (5 marks) i. Calculate gross profit for each customer along with product name and payment type using Pivot Table; categorising the columns by sales person ii. Calculate sales revenue by each sales person using Pivot Table and illustrate it via Clustered Bar Chart iii. Calculate sales revenue and gross profit earned by each product using Pivot Table and illustrate it via 100% stacked line graph For Pivot Tables and charts, please use a new worksheet and label it as (Pivot and Charts). You must use relevant Excel functions for the tasks assigned. Do not calculate it manually. PART C. Discuss, justify and illustrate the following features that can be included, to help with strategic decision making. (10 marks) SUMIF COUNTIF Forecasting Index Match Function IF with And/OR Use suitable data for the purpose of illustration, on separate sheets. Feel free to use data from this question / other sources. Yume International is the New Zealand largest food & beverage wholesaler to cafes and convenience stores in Australia. You are provided with the information related to its customer details, product details, and costs and revenue information sheet. Yume International has partnered with three shipping companies who ships the products to its Australian customers on time. You are a junior accountant and your Senior Accounts Manager wants you to summarise this data in a meaningful way. Required: PART- A: Complete missing information in costs and revenue information sheet (highlighted in yellow colour) (5 marks) PART B: Pivot Table and Recommended Charts (5 marks) i. Calculate gross profit for each customer along with product name and payment type using Pivot Table; categorising the columns by sales person ii. Calculate sales revenue by each sales person using Pivot Table and illustrate it via Clustered Bar Chart iii. Calculate sales revenue and gross profit earned by each product using Pivot Table and illustrate it via 100% stacked line graph For Pivot Tables and charts, please use a new worksheet and label it as (Pivot and Charts). You must use relevant Excel functions for the tasks assigned. Do not calculate it manually. PART C. Discuss, justify and illustrate the following features that can be included, to help with strategic decision making. (10 marks) SUMIF COUNTIF Forecasting Index Match Function IF with And/OR Use suitable data for the purpose of illustration, on separate sheets. Feel free to use data from this question / other sources
Answer & Explanation
Solved by verified expert
Get Answers to Unlimited Questions
Join us to gain access to millions of questions and expert answers. Enjoy exclusive benefits tailored just for you!
Membership Benefits:
Unlimited Question Access with detailed Answers
Zin AI - 3 Million Words
10 Dall-E 3 Images
20 Plot Generations
Conversation with Dialogue Memory
No Ads, Ever!
Access to Our Best AI Platform: Zin AI - Your personal assistant for all your inquiries!