Using the annual report and accounts (Refer the below financial statements), identify the 2017 and...
60.1K
Verified Solution
Link Copied!
Question
Accounting
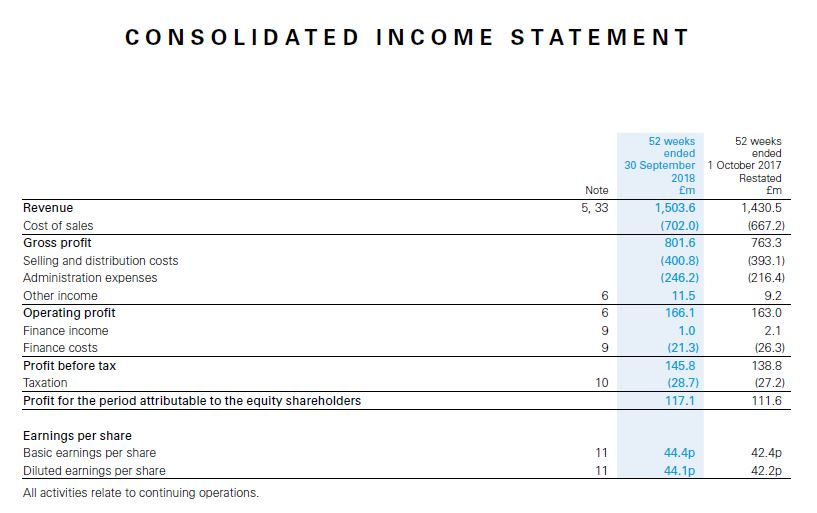
Using the annual report and accounts (Refer the below financial statements), identify the 2017 and 2018 value, calculate the percentage movement on the following figures from 2017 to 2018 for the following measures:
Revenue, Operating profit / loss, Capital employed show workings if needed, Total assets, Net cash generated / used in operating activities, Number of employees, Earnings per share, Total dividend paid per ordinary share, Year-end market, Year-end market capitalization using share price above. Show calculation
Calculate, for BOTH the current and the previous year, the following ratios that help to highlight the companys performance for the trading period. Show definitions and workings/ Solution steps:
The detailed report is accesssible from https://www.britvic.com/~/media/Files/B/Britvic-V3/documents/pdf/presentation/2018/annual-report-2018.pdf
Current Year , Previous Year % Movement
Revenue
Operating profit / loss
Capital employed show workings if needed
Total assets
Net cash generated / used in operating activities
Number of employees
Earnings per share
Total dividend paid per ordinary share
Year-end share price
Year-end market
Year-end market capitalization using share price above. Show calculation
CONSOLIDATED INCOME STATEMENT Note 5,33 52 weeks 52 weeks ended ended 30 September 1 October 2017 2018 Restated Em Em 1,503.6 1,430.5 (702.0) 1667.2) 801.6 763.3 (400.8) (393.1) (246.2) 216.4) 11.5 9.2 166.1 163.0 1.0 2.1 (21.3) (26.3) 145.8 138.8 (28.7) (27.2) 117.1 111.6 Revenue Cost of sales Gross profit Selling and distribution costs Administration expenses Other income Operating profit Finance income Finance costs Profit before tax Taxation Profit for the period attributable to the equity shareholders 6 6 9 9 10 Earnings per share Basic earnings per share Diluted earnings per share All activities relate to continuing operations. 11 11 44.4p 44.1p 42.4p 42.2p CONSOLIDATED BALANCE SHEET 30 September October 2017 2018 Restated Em Em Note 13 14 Assets Non-current assets Property, plant and equipment Intangible assets Other receivables Derivative financial instruments Deferred tax asset Pension asset 25 10f 22 519.8 439.5 7.7 40.5 5.6 96.3 1,109.4 461.6 455.0 6.7 69.7 7.5 40.5 1,041.0 Current assets Inventories Trade and other receivables Current income tax receivables Derivative financial instruments Cash and cash equivalents 16 17 10c 25 18 144.5 356.8 2.3 37.9 109.5 651.0 1,760.4 146.7 321.1 4.5 17.2 82.5 572.0 1,613.0 Total assets Current liabilities Trade and other payables Contract liabilities - rebate accruals Interest bearing loans and borrowings Derivative financial instruments Current income tax payable Provisions Other current liabilities 23 33 21 25 10c 26 31 (424.3) (97.4) (171.4) (0.7) (2.2) (2.6) (0.2) (698.8) (384.9) (87.7) (89.7) (2.7) (12.4) (3.7) (36.71 (617.8) Non-current liabilities Interest bearing loans and borrowings Deferred tax liabilities Pension liability Derivative financial instruments Provisions Other non-current liabilities 21 10f 22 25 26 (597.7) (62.5) (9.4) (4.2) 17.4) (3.1) (684.3) (1,383.1) 377.3 (582.7) (51.4) (9.3) (4.1) (5.0) (3.4) (655.9) (1,273.7) 339.3 Total liabilities Net assets Capital and reserves Issued share capital 19 52.9 52.8 Share premium account 139.1 133.9 Own shares reserve (5.4) (3.7) Other reserves 20 92.9 130.5 Retained earnings 97.8 25.8 Total equity 377.3 339.3 The financial statements were approved by the board of directors and authorised for issue on 28 November 2018. They were signed on its behalf by: CONSOLIDATED STATEMENT OF COMPREHENSIVE INCOME/(EXPENSE) 52 weeks ended 30 September 2018 fm 117.1 52 weeks ended 1 October 2017 Em 111.6 Note Profit for the period attributable to the equity shareholders Other comprehensive income/expense): Items that will not be reclassified to profit or loss Remeasurement gains on defined benefit pension schemes Deferred tax on defined benefit pension schemes Deferred tax on other temporary differences 22 10a 10a 33.3 (5.5) 26.7 (4.2) 0.1 22.6 27.8 Items that may be subsequently reclassified to profit or loss Losses in the period in respect of cash flow hedges Amounts recycled to the income statement in respect of cash flow hedges Deferred tax in respect of cash flow hedges accounted for in the hedging reserve Exchange differences on translation of foreign operations Tax on exchange differences accounted for in the translation reserve 25 25 10a 25 (2.6) (0.4) 0.5 (35.1) (3.2) (7.0) 1.7 (1.3) (6.1) (15.9) 10a (37.6) Other comprehensive income for the period, net of tax Total comprehensive income for the period attributable to the equity shareholders (9.8) 107.3 6.7 118.3 CONSOLIDATED STATEMENT OF CHANGES IN EQUITY Issued share capital Share premium account Em 129.1 Own shares reserve Other reserves Inote 20) Em 146.5 Retained earnings/ flosses Em Em Em Total Em 281.0 At 2 October 2016 52.6 (3.3) (43.9) - (15.9) (15.9) 111.6 22.6 134.2 111.6 6.7 118.3 0.2 Profit for the period Other comprehensive expense/income Total comprehensive (expensel/income Issue of shares relating to incentive schemes for employees Own shares purchased for share schemes Own shares utilised for share schemes Movement in share based schemes Current tax on share based payments Deferred tax on share based payments Movement in non-distributable profit Payment of dividend At 1 October 2017 (4.4) (4.8) 8.8 colo (7.9) 6.1 0.1 2.0 0.1 (64.9) 25.8 0.6 (4.8) 0.9 6.1 0.1 2.0 10.1) (64.9 339.3 52.8 133.9 13.7) 130.5 - Profit for the period Other comprehensive lexpensel/income Total comprehensive (expensel/income (37.6) (37.6) 117.1 27.8 144.9 117.1 (9.8) 107.3 0.1 5.2 (4.4) (5.21 7.9 Issue of shares relating to incentive schemes for employees Own shares purchased for share schemes Own shares utilised for share schemes Movement in share based schemes Current tax on share based payments Payment of dividend At 30 September 2018 (7.1) 5.5 0.4 (71.7) 97.8 0.9 (5.2) 0.8 5.5 0.4 (71.71 377.3 52.9 139.1 (5.4) 92.9 CONSOLIDATED STATEMENT OF CASH FLOWS 52 weeks ended 30 September 2018 Em 52 weeks ended 1 October 2017 Note Em 9 138.8 24.2 13.5 Cash flows from operating activities Profit before tax Net finance costs Other financial instruments Impairment of property, plant and equipment Reversal of impairment of intangible assets Depreciation Amortisation Share based payments Net pension charge less contributions Increase in inventory (Increase\/decrease in trade and other receivables Increase in trade, other payables and contract liabilities Increase/(decrease) in provisions Loss on disposal of property, plant and equipment and intangible assets Income tax paid Net cash flows from operating activities 13 14 13 14 27 145.8 20.3 0.6 4.8 (11.5) 48.5 18.4 5.6 (22.1) (3.3) (44.9) 66.4 4.5 4.5 (30.8) 206.8 (2.6) 40.3 19.0 6.3 (22.1) (24.2) 4.3 41.2 (4.9) 1.6 (37.4) 198.0 Cash flows from investing activities Proceeds from sale of property, plant and equipment Purchases of property, plant and equipment Purchases of intangible assets Interest received Acquisition of subsidiaries, net of cash acquired Net cash flows used in investing activities (136.3) (7.3) 0.9 (38.4) (181.1) 17.7 (139.8) 16.9) 0.8 160.3) (188.5) 31 (22.0) 35.3 (0.7) (1.1) Cash flows from financing activities Interest paid, net of derivative financial instruments Net movement on revolving credit facility Other loans repaid Repayment on finance leases Acquired debt repaid Partial repayment of private placement notes Drawdown of 2018/2017 private placement notes Issue costs paid Issue of shares relating to incentive schemes for employees Purchase of own shares Dividends paid to equity shareholders Net cash flows used in financing activities Net increase/decrease) in cash and cash equivalents Cash and cash equivalents at beginning of period Exchange rate differences Cash and cash equivalents at the end of the period (20.8) 191.4) (0.6) (0.8) (2.4) (119.6) 175.0 21 21 21 21 21 21 21 (0.7) 12 (54.9) 120.3 (0.4) 1.0 (3.1) (71.7) 2.7 28.4 82.5 (1.4) 109.5 0.7 (5.3) (64.9) (130.8) (121.3) 205.9 (2.1) 82.5 18 CONSOLIDATED INCOME STATEMENT Note 5,33 52 weeks 52 weeks ended ended 30 September 1 October 2017 2018 Restated Em Em 1,503.6 1,430.5 (702.0) 1667.2) 801.6 763.3 (400.8) (393.1) (246.2) 216.4) 11.5 9.2 166.1 163.0 1.0 2.1 (21.3) (26.3) 145.8 138.8 (28.7) (27.2) 117.1 111.6 Revenue Cost of sales Gross profit Selling and distribution costs Administration expenses Other income Operating profit Finance income Finance costs Profit before tax Taxation Profit for the period attributable to the equity shareholders 6 6 9 9 10 Earnings per share Basic earnings per share Diluted earnings per share All activities relate to continuing operations. 11 11 44.4p 44.1p 42.4p 42.2p CONSOLIDATED BALANCE SHEET 30 September October 2017 2018 Restated Em Em Note 13 14 Assets Non-current assets Property, plant and equipment Intangible assets Other receivables Derivative financial instruments Deferred tax asset Pension asset 25 10f 22 519.8 439.5 7.7 40.5 5.6 96.3 1,109.4 461.6 455.0 6.7 69.7 7.5 40.5 1,041.0 Current assets Inventories Trade and other receivables Current income tax receivables Derivative financial instruments Cash and cash equivalents 16 17 10c 25 18 144.5 356.8 2.3 37.9 109.5 651.0 1,760.4 146.7 321.1 4.5 17.2 82.5 572.0 1,613.0 Total assets Current liabilities Trade and other payables Contract liabilities - rebate accruals Interest bearing loans and borrowings Derivative financial instruments Current income tax payable Provisions Other current liabilities 23 33 21 25 10c 26 31 (424.3) (97.4) (171.4) (0.7) (2.2) (2.6) (0.2) (698.8) (384.9) (87.7) (89.7) (2.7) (12.4) (3.7) (36.71 (617.8) Non-current liabilities Interest bearing loans and borrowings Deferred tax liabilities Pension liability Derivative financial instruments Provisions Other non-current liabilities 21 10f 22 25 26 (597.7) (62.5) (9.4) (4.2) 17.4) (3.1) (684.3) (1,383.1) 377.3 (582.7) (51.4) (9.3) (4.1) (5.0) (3.4) (655.9) (1,273.7) 339.3 Total liabilities Net assets Capital and reserves Issued share capital 19 52.9 52.8 Share premium account 139.1 133.9 Own shares reserve (5.4) (3.7) Other reserves 20 92.9 130.5 Retained earnings 97.8 25.8 Total equity 377.3 339.3 The financial statements were approved by the board of directors and authorised for issue on 28 November 2018. They were signed on its behalf by: CONSOLIDATED STATEMENT OF COMPREHENSIVE INCOME/(EXPENSE) 52 weeks ended 30 September 2018 fm 117.1 52 weeks ended 1 October 2017 Em 111.6 Note Profit for the period attributable to the equity shareholders Other comprehensive income/expense): Items that will not be reclassified to profit or loss Remeasurement gains on defined benefit pension schemes Deferred tax on defined benefit pension schemes Deferred tax on other temporary differences 22 10a 10a 33.3 (5.5) 26.7 (4.2) 0.1 22.6 27.8 Items that may be subsequently reclassified to profit or loss Losses in the period in respect of cash flow hedges Amounts recycled to the income statement in respect of cash flow hedges Deferred tax in respect of cash flow hedges accounted for in the hedging reserve Exchange differences on translation of foreign operations Tax on exchange differences accounted for in the translation reserve 25 25 10a 25 (2.6) (0.4) 0.5 (35.1) (3.2) (7.0) 1.7 (1.3) (6.1) (15.9) 10a (37.6) Other comprehensive income for the period, net of tax Total comprehensive income for the period attributable to the equity shareholders (9.8) 107.3 6.7 118.3 CONSOLIDATED STATEMENT OF CHANGES IN EQUITY Issued share capital Share premium account Em 129.1 Own shares reserve Other reserves Inote 20) Em 146.5 Retained earnings/ flosses Em Em Em Total Em 281.0 At 2 October 2016 52.6 (3.3) (43.9) - (15.9) (15.9) 111.6 22.6 134.2 111.6 6.7 118.3 0.2 Profit for the period Other comprehensive expense/income Total comprehensive (expensel/income Issue of shares relating to incentive schemes for employees Own shares purchased for share schemes Own shares utilised for share schemes Movement in share based schemes Current tax on share based payments Deferred tax on share based payments Movement in non-distributable profit Payment of dividend At 1 October 2017 (4.4) (4.8) 8.8 colo (7.9) 6.1 0.1 2.0 0.1 (64.9) 25.8 0.6 (4.8) 0.9 6.1 0.1 2.0 10.1) (64.9 339.3 52.8 133.9 13.7) 130.5 - Profit for the period Other comprehensive lexpensel/income Total comprehensive (expensel/income (37.6) (37.6) 117.1 27.8 144.9 117.1 (9.8) 107.3 0.1 5.2 (4.4) (5.21 7.9 Issue of shares relating to incentive schemes for employees Own shares purchased for share schemes Own shares utilised for share schemes Movement in share based schemes Current tax on share based payments Payment of dividend At 30 September 2018 (7.1) 5.5 0.4 (71.7) 97.8 0.9 (5.2) 0.8 5.5 0.4 (71.71 377.3 52.9 139.1 (5.4) 92.9 CONSOLIDATED STATEMENT OF CASH FLOWS 52 weeks ended 30 September 2018 Em 52 weeks ended 1 October 2017 Note Em 9 138.8 24.2 13.5 Cash flows from operating activities Profit before tax Net finance costs Other financial instruments Impairment of property, plant and equipment Reversal of impairment of intangible assets Depreciation Amortisation Share based payments Net pension charge less contributions Increase in inventory (Increase\/decrease in trade and other receivables Increase in trade, other payables and contract liabilities Increase/(decrease) in provisions Loss on disposal of property, plant and equipment and intangible assets Income tax paid Net cash flows from operating activities 13 14 13 14 27 145.8 20.3 0.6 4.8 (11.5) 48.5 18.4 5.6 (22.1) (3.3) (44.9) 66.4 4.5 4.5 (30.8) 206.8 (2.6) 40.3 19.0 6.3 (22.1) (24.2) 4.3 41.2 (4.9) 1.6 (37.4) 198.0 Cash flows from investing activities Proceeds from sale of property, plant and equipment Purchases of property, plant and equipment Purchases of intangible assets Interest received Acquisition of subsidiaries, net of cash acquired Net cash flows used in investing activities (136.3) (7.3) 0.9 (38.4) (181.1) 17.7 (139.8) 16.9) 0.8 160.3) (188.5) 31 (22.0) 35.3 (0.7) (1.1) Cash flows from financing activities Interest paid, net of derivative financial instruments Net movement on revolving credit facility Other loans repaid Repayment on finance leases Acquired debt repaid Partial repayment of private placement notes Drawdown of 2018/2017 private placement notes Issue costs paid Issue of shares relating to incentive schemes for employees Purchase of own shares Dividends paid to equity shareholders Net cash flows used in financing activities Net increase/decrease) in cash and cash equivalents Cash and cash equivalents at beginning of period Exchange rate differences Cash and cash equivalents at the end of the period (20.8) 191.4) (0.6) (0.8) (2.4) (119.6) 175.0 21 21 21 21 21 21 21 (0.7) 12 (54.9) 120.3 (0.4) 1.0 (3.1) (71.7) 2.7 28.4 82.5 (1.4) 109.5 0.7 (5.3) (64.9) (130.8) (121.3) 205.9 (2.1) 82.5 18
Answer & Explanation
Solved by verified expert
Get Answers to Unlimited Questions
Join us to gain access to millions of questions and expert answers. Enjoy exclusive benefits tailored just for you!
Membership Benefits:
Unlimited Question Access with detailed Answers
Zin AI - 3 Million Words
10 Dall-E 3 Images
20 Plot Generations
Conversation with Dialogue Memory
No Ads, Ever!
Access to Our Best AI Platform: Zin AI - Your personal assistant for all your inquiries!