Use the Relationship Between the F Test Statistic and the P value flow chart interactive...
80.2K
Verified Solution
Link Copied!
Question
Statistics
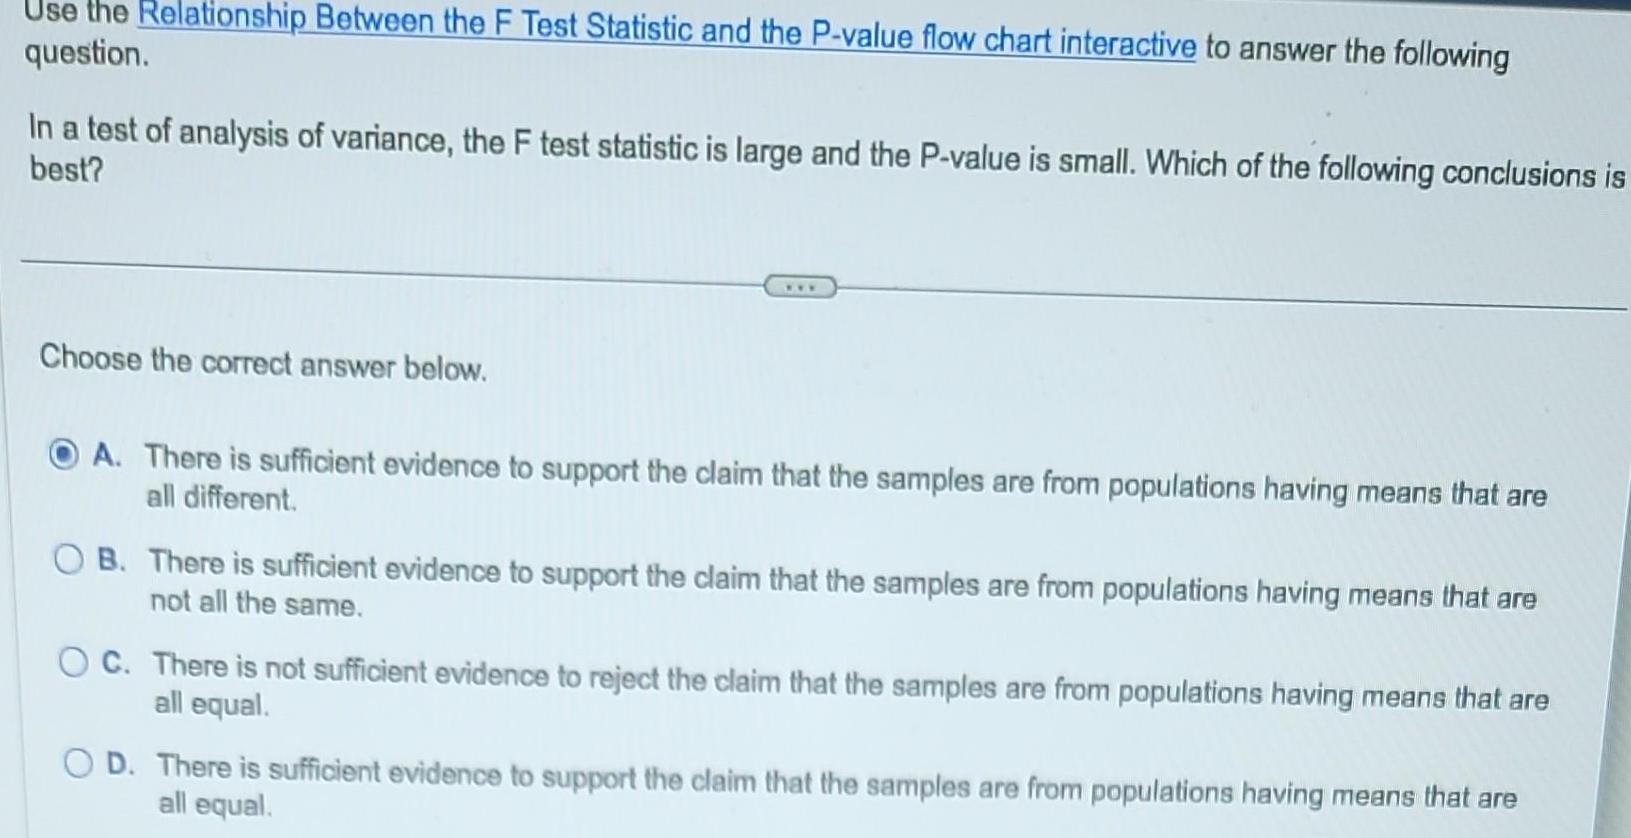
Use the Relationship Between the F Test Statistic and the P value flow chart interactive to answer the following question In a test of analysis of variance the F test statistic is large and the P value is small Which of the following conclusions is best Choose the correct answer below A There is sufficient evidence to support the claim that the samples are from populations having means that are all different OB There is sufficient evidence to support the claim that the samples are from populations having means that are not all the same OC There is not sufficient evidence to reject the claim that the samples are from populations having means that are all equal OD There is sufficient evidence to support the claim that the samples are from populations having means that are all equal
Answer & Explanation
Solved by verified expert
Get Answers to Unlimited Questions
Join us to gain access to millions of questions and expert answers. Enjoy exclusive benefits tailored just for you!
Membership Benefits:
Unlimited Question Access with detailed Answers
Zin AI - 3 Million Words
10 Dall-E 3 Images
20 Plot Generations
Conversation with Dialogue Memory
No Ads, Ever!
Access to Our Best AI Platform: Zin AI - Your personal assistant for all your inquiries!