The plot shows an oxygen binding curve for human hemoglobin Y fractional saturation 1 0...
80.2K
Verified Solution
Link Copied!
Question
Biology
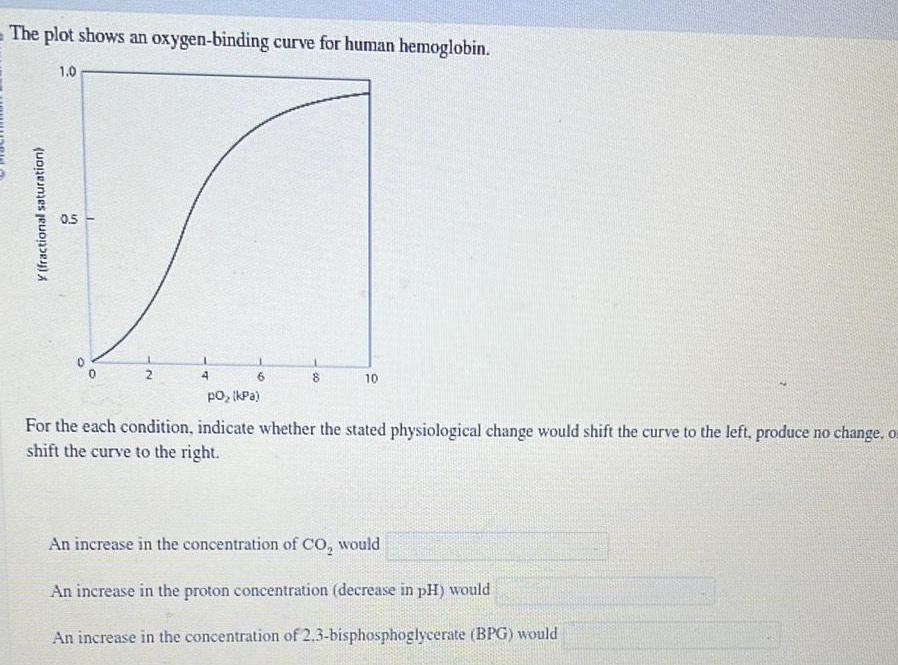
The plot shows an oxygen binding curve for human hemoglobin Y fractional saturation 1 0 0 5 2 1 4 6 po kPa 00 8 10 For the each condition indicate whether the stated physiological change would shift the curve to the left produce no change o shift the curve to the right An increase in the concentration of CO would An increase in the proton concentration decrease in pH would An increase in the concentration of 2 3 bisphosphoglycerate BPG would
Answer & Explanation
Solved by verified expert
Get Answers to Unlimited Questions
Join us to gain access to millions of questions and expert answers. Enjoy exclusive benefits tailored just for you!
Membership Benefits:
Unlimited Question Access with detailed Answers
Zin AI - 3 Million Words
10 Dall-E 3 Images
20 Plot Generations
Conversation with Dialogue Memory
No Ads, Ever!
Access to Our Best AI Platform: Zin AI - Your personal assistant for all your inquiries!