
Transcribed Image Text
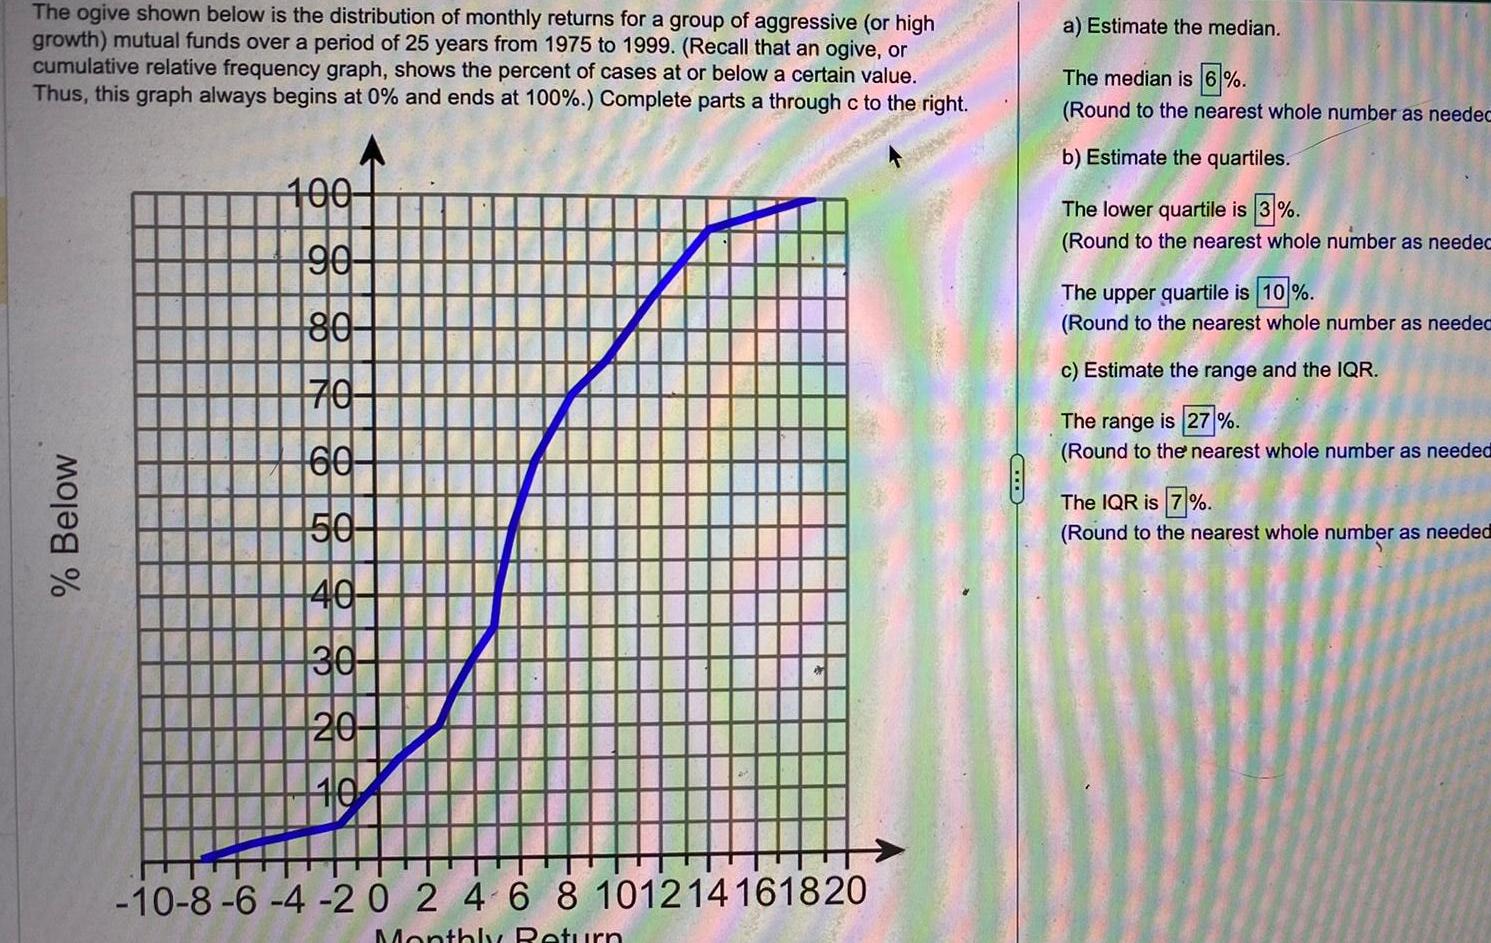
The ogive shown below is the distribution of monthly returns for a group of aggressive (or high growth) mutual funds over a period of 25 years from 1975 to 1999. (Recall that an ogive, or cumulative relative frequency graph, shows the percent of cases at or below a certain value. Thus, this graph always begins at 0% and ends at 100%.) Complete parts a through c to the right.a) Estimate the median.The median is 6%.(Round to the nearest whole number as needecb) Estimate the quartiles.The lower quartile is 3%.(Round to the nearest whole number as neededThe upper quartile is 10%.(Round to the nearest whole number as neededc) Estimate the range and the IQR.The range is 27%.(Round to the nearest whole number as neededThe IQR is 7%.(Round to the nearest whole number as needed