The line graph to the right shows the average gasoline prices of a country from...
90.2K
Verified Solution
Link Copied!
Question
Basic Math
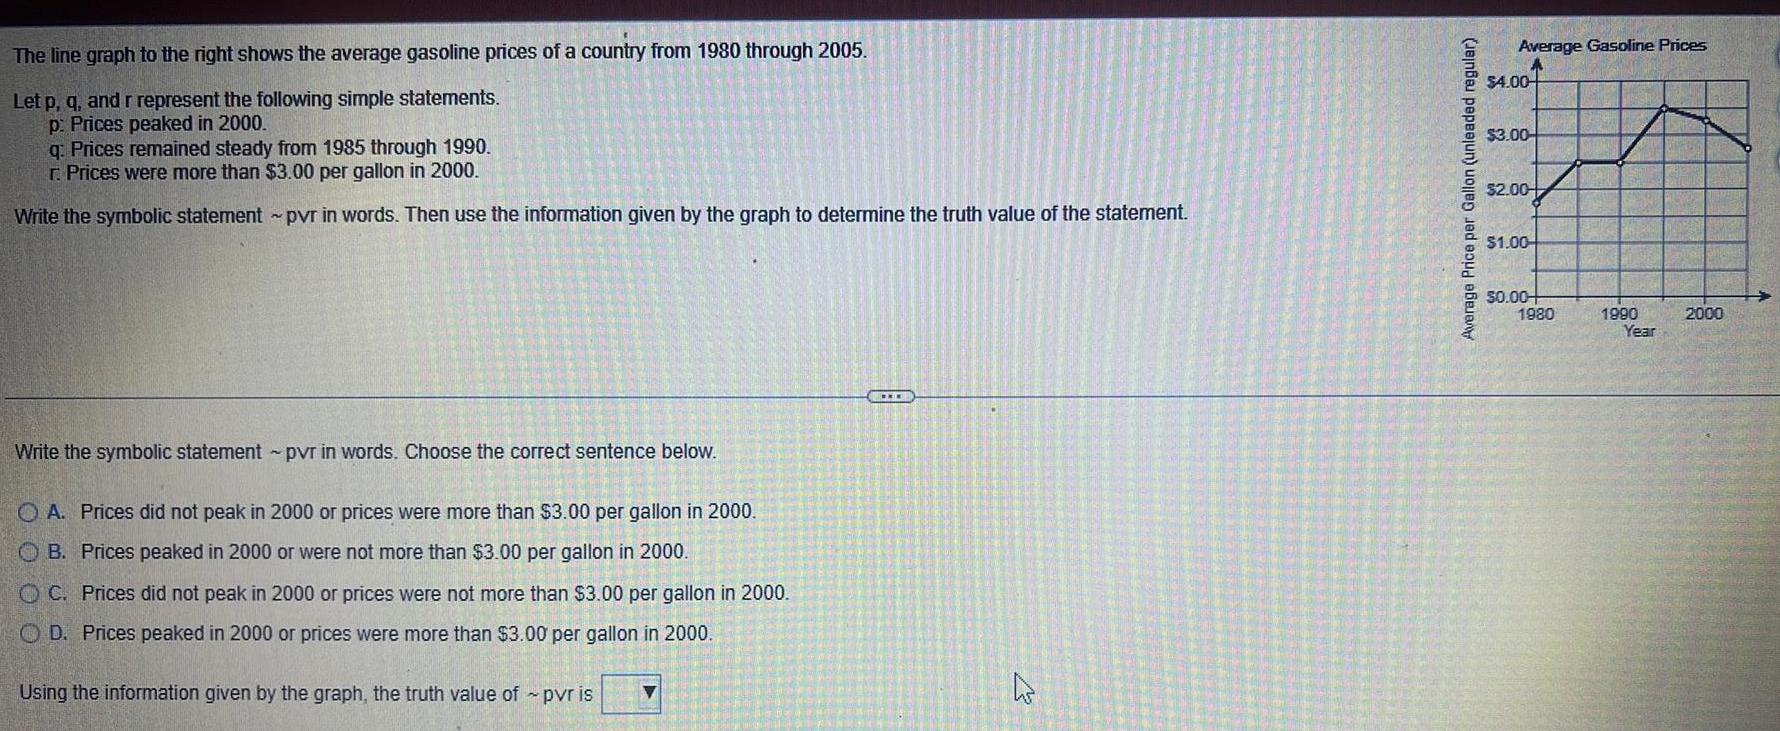
The line graph to the right shows the average gasoline prices of a country from 1980 through 2005 Let p q and r represent the following simple statements p Prices peaked in 2000 q Prices remained steady from 1985 through 1990 r Prices were more than 3 00 per gallon in 2000 Write the symbolic statement pvr in words Then use the information given by the graph to determine the truth value of the statement Write the symbolic statement pvr in words Choose the correct sentence below OA Prices did not peak in 2000 or prices were more than 3 00 per gallon in 2000 OB Prices peaked in 2000 or were not more than 3 00 per gallon in 2000 OC Prices did not peak in 2000 or prices were not more than 3 00 per gallon in 2000 OD Prices peaked in 2000 or prices were more than 3 00 per gallon in 2000 Using the information given by the graph the truth value of pvr is 4 Average Price per Gallon unleaded regular Average Gasoline Prices 4 00 3 00 2 00 1 00 50 00 1980 1990 Year 2000
Answer & Explanation
Solved by verified expert
Get Answers to Unlimited Questions
Join us to gain access to millions of questions and expert answers. Enjoy exclusive benefits tailored just for you!
Membership Benefits:
Unlimited Question Access with detailed Answers
Zin AI - 3 Million Words
10 Dall-E 3 Images
20 Plot Generations
Conversation with Dialogue Memory
No Ads, Ever!
Access to Our Best AI Platform: Zin AI - Your personal assistant for all your inquiries!