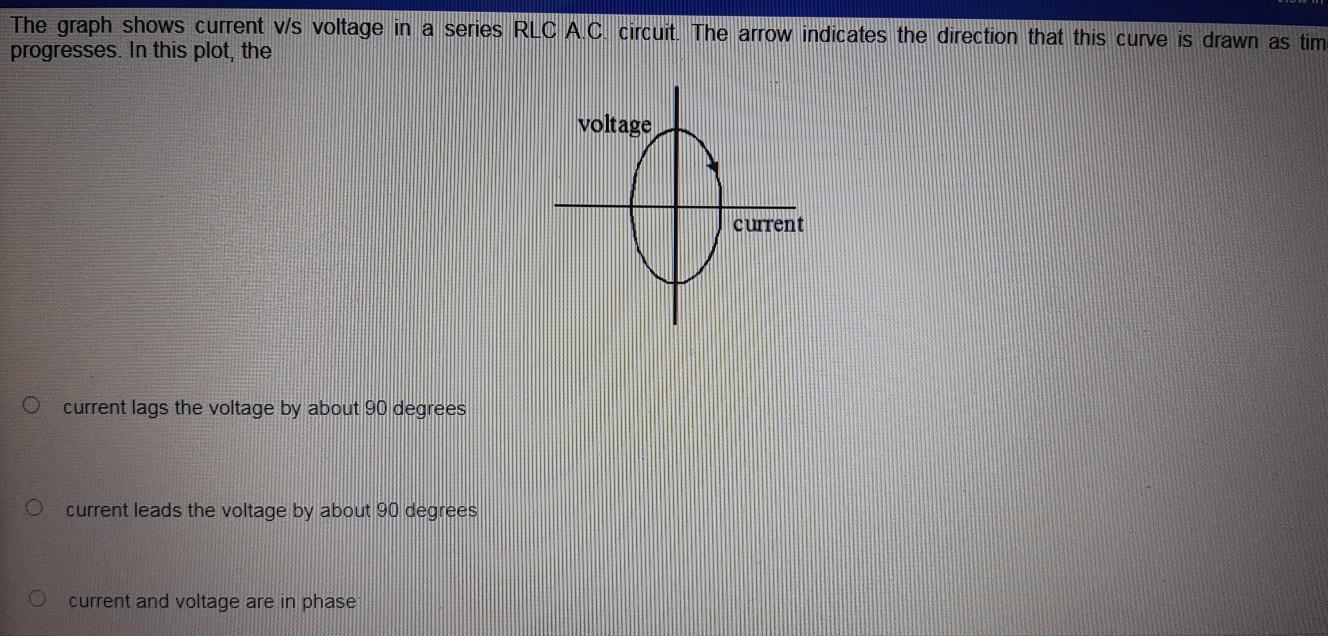
The graph shows current v s voltage in a series RLC A C circuit The...
70.2K
Verified Solution
Link Copied!
Question
Physics
The graph shows current v s voltage in a series RLC A C circuit The arrow indicates the direction that this curve is drawn as tim progresses In this plot the O O current lags the voltage by about 90 degrees current leads the voltage by about 90 degrees O current and voltage are in phase voltage current
Answer & Explanation
Solved by verified expert
Get Answers to Unlimited Questions
Join us to gain access to millions of questions and expert answers. Enjoy exclusive benefits tailored just for you!
Membership Benefits:
Unlimited Question Access with detailed Answers
Zin AI - 3 Million Words
10 Dall-E 3 Images
20 Plot Generations
Conversation with Dialogue Memory
No Ads, Ever!
Access to Our Best AI Platform: Zin AI - Your personal assistant for all your inquiries!