The graph illustrates a normal distribution for the prices paid for a particular model of...
50.1K
Verified Solution
Link Copied!
Question
Statistics
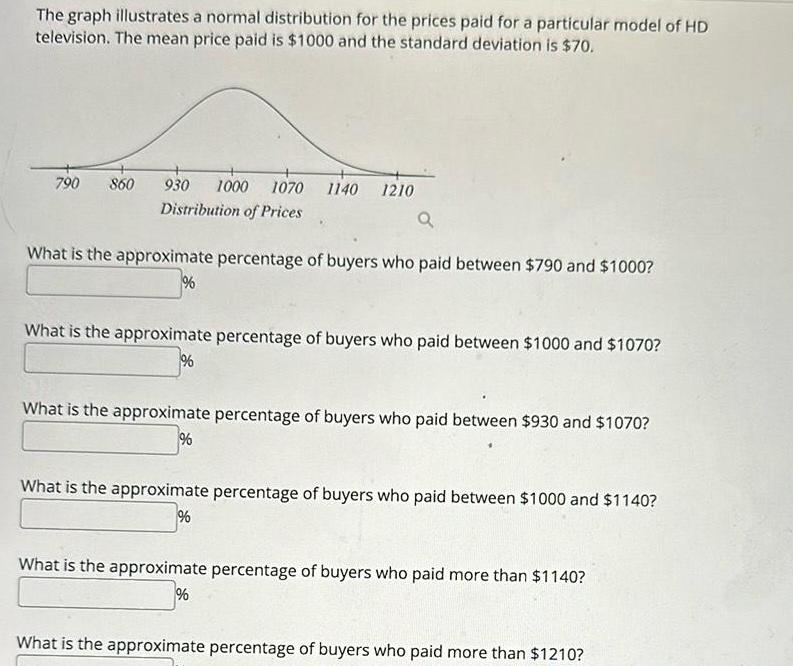
The graph illustrates a normal distribution for the prices paid for a particular model of HD television The mean price paid is 1000 and the standard deviation is 70 790 860 930 1000 1070 1140 1210 Distribution of Prices Q What is the approximate percentage of buyers who paid between 790 and 1000 What is the approximate percentage of buyers who paid between 1000 and 1070 What is the approximate percentage of buyers who paid between 930 and 1070 What is the approximate percentage of buyers who paid between 1000 and 1140 What is the approximate percentage of buyers who paid more than 1140 What is the approximate percentage of buyers who paid more than 1210
Answer & Explanation
Solved by verified expert
Get Answers to Unlimited Questions
Join us to gain access to millions of questions and expert answers. Enjoy exclusive benefits tailored just for you!
Membership Benefits:
Unlimited Question Access with detailed Answers
Zin AI - 3 Million Words
10 Dall-E 3 Images
20 Plot Generations
Conversation with Dialogue Memory
No Ads, Ever!
Access to Our Best AI Platform: Zin AI - Your personal assistant for all your inquiries!