The following information relates to Handy Hardware Incorporated, and All Tools Corporation for their 2017...
70.2K
Verified Solution
Link Copied!
Question
Accounting
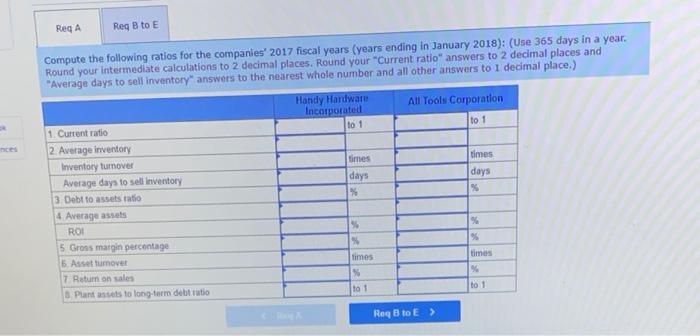
The following information relates to Handy Hardware Incorporated, and All Tools Corporation for their 2017 and 2016 fiscal years. HANDY HARDWARE INCORPORATED Selected Financial Information wounts In willlons, except per share amounts) Total current assets Merchandise Inventory Property and equipment, net of depreciation Total assets Total current Habilities Total long-term Habilities Total abilities Total shareholders' equity Revenue Cost of goods sold Gross profit Operating income Earnings from continuing operations before income tax expense Incontre ut earning Hasierines per there January 28 2018 $ 25,754 12,504 23,205 52,660 4.725 45,978 50,701 1.959 98,560 66,604 31,956 12,514 16,07 14.351 11.756 5.7.45 January 29, 2017 $ 21,715 16,412 24, 125 56,627 14,193 34,805 48998 7,629 74,097 25,887 48,210 11, se 26,277 0,325 17,952 5.6.50 ol ances ALL TOOLS CORPORATION Selected Financial Information amounts in millions except per share data) January 24, 2018 Total current assets $ 16,057 Merchandise Inventory 9,541 Property and equipment, net of depreciation 14,396 Total assets 31,994 Total current liabilities 13,851 Total long-term liabilities 11,942 Total liabilities 25,793 Total stockholders equity 6,201 Revenues 65, 669 Cost of goods sold 41,517 Gross profit 24,152 Operating incond 6,440 Earnings from continuing operations before income taxes 5,252 Income tax expense 1,959 Het earnings 3,293 Basic earnings per share $ 3.60 Required o. Compute the following ratios for the companies 2017 fiscal years (years ending in January 2018) (1) Current ratio (2) Average days to sell Inventory (Use average inventory) January 25, 2017 $ 14,219 10,635 14,988 34,598 9,953 9,482 19,435 15,163 48,131 31,308 16,823 4,888 3,404 2,298 1,106 $ 2.85 Required a. Compute the following ratios for the companies 2017 fiscal years (years ending in January 2018) (1) Current ratio (2) Average days to sell inventory (Use average inventory) (3) Debt-to-assets ratio (4) Return on investment. (Use average assets and use "Earnings from continuing operations before income taxes" rather than net earnings (5) Gross margin percentage (6) Asset turnover. (Use average assets) (7) Return on sales. (Use "Earnings from continuing operations before income taxes" rather than "net earnings." (8) Plant assets to long-term debt ratio b. Which company appears to be more profitable? Identify which ratio(s) from Requirement a you used to reach your conclusion c. Which company appears to have the higher level of financial risk? Identify which ratio(s) from Requirement a you used to reach your conclusion d. Which company appears to be charging higher prices for its goods? Identity which ratio(s) from Requirement a you used to reach your conclusion e. Which company appears to be the more efficient at using its assets? Identity which ratio(s) from Requirement a you used to reach your conclusion ReqA Reg B to E nes Compute the following ratios for the companies' 2017 fiscal years (years ending in January 2018): (Use 365 days in a year. Round your intermediate calculations to 2 decimal places. Round your "Current ratio answers to 2 decimal places and "Average days to sell inventory" answers to the nearest whole number and all other answers to 1 decimal place.) Handy Hardware All Tools Corporation Incorporated 1. Current ratio to 1 to 1 2. Average inventory Inventory tumover times times Average days to sell inventory days 3 Debt to assestatio % % 4 Average asses ROI % 5 Gross margin percentage % % 5. Asset Turnover times times 7 Return on sales 5 96 Plantes to long-term debt ratio tot to 1 days ReqtoE > ReqA Reg to E b. Which company appears to be more profitable7 Identify which ratio(s) from Requirement a you used to reach your conclusion. c. Which company appears to have the higher level of financial risk? Identify which ratio(s) from Requirement a you used to reach your conclusion d. Which company appears to be charging higher prices for its good? Identify which ratio(o) from Requirement a you used to reach your conclusion . Which company appears to be the more efficient at using its assets? Identify which ratio(s) from Requirement a you used to reach your conclusion Show less Company Ratio(s) Used b. More profitable? c. Higher level of financial risk? d. Charging higher prices? e More efficient at using assets?
Answer & Explanation
Solved by verified expert
Get Answers to Unlimited Questions
Join us to gain access to millions of questions and expert answers. Enjoy exclusive benefits tailored just for you!
Membership Benefits:
Unlimited Question Access with detailed Answers
Zin AI - 3 Million Words
10 Dall-E 3 Images
20 Plot Generations
Conversation with Dialogue Memory
No Ads, Ever!
Access to Our Best AI Platform: Zin AI - Your personal assistant for all your inquiries!