The following frequency histogram represents the IQ scores of a random sample of seventh grade...
70.2K
Verified Solution
Link Copied!
Question
Statistics
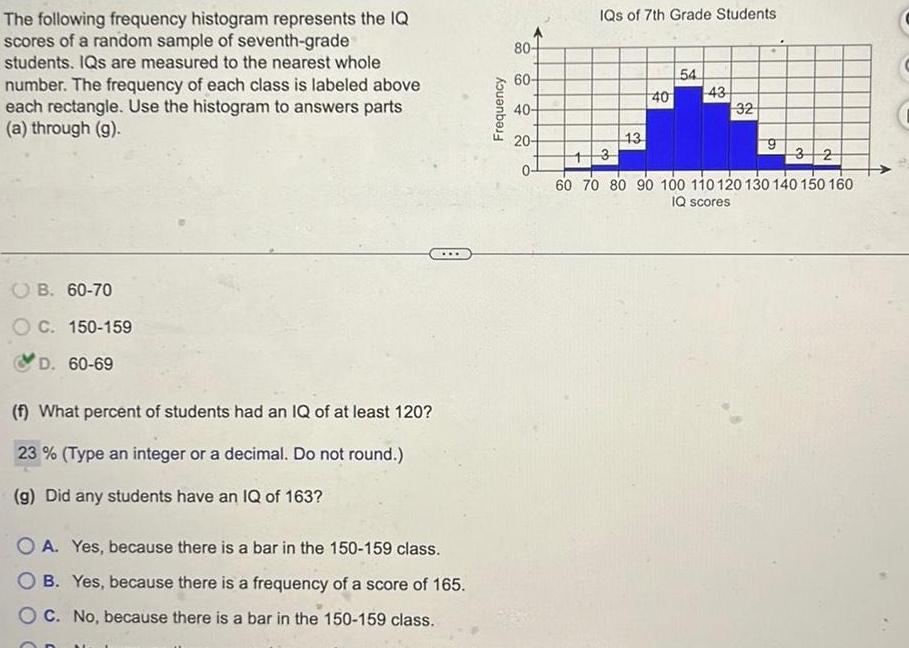
The following frequency histogram represents the IQ scores of a random sample of seventh grade students IQs are measured to the nearest whole number The frequency of each class is labeled above each rectangle Use the histogram to answers parts a through g B 60 70 C 150 159 D 60 69 f What percent of students had an IQ of at least 120 23 Type an integer or a decimal Do not round g Did any students have an IQ of 163 OA Yes because there is a bar in the 150 159 class OB Yes because there is a frequency of a score of 165 OC No because there is a bar in the 150 159 class Frequency 80 60 40 20 0 IQs of 7th Grade Students 13 40 54 43 32 9 3 2 13 60 70 80 90 100 110 120 130 140 150 160 IQ scores
Answer & Explanation
Solved by verified expert
Get Answers to Unlimited Questions
Join us to gain access to millions of questions and expert answers. Enjoy exclusive benefits tailored just for you!
Membership Benefits:
Unlimited Question Access with detailed Answers
Zin AI - 3 Million Words
10 Dall-E 3 Images
20 Plot Generations
Conversation with Dialogue Memory
No Ads, Ever!
Access to Our Best AI Platform: Zin AI - Your personal assistant for all your inquiries!