The following financial statements and information are available for Solomon Industries Inc. Balance Sheets As...
90.2K
Verified Solution
Link Copied!
Question
Accounting
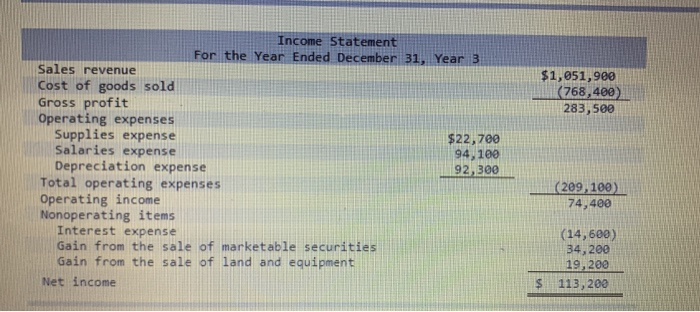
The following financial statements and information are available for Solomon Industries Inc. Balance Sheets As of December 31 Year 3 Year 2 162,480 105,300 188,100 294,700 681,400 (307,700) 82,000 1,206,200 $ 122,600 86,800 173,800 222,000 492,500 (237,900) 118,400 978, 200 Assets Cash Accounts receivable Inventory Marketable securities (available for sale) Equipment Accumulated depreciation Land Total assets Liabilities and equity Liabilities Accounts payable (inventory) Notes payable-Long-term Bonds payable Total liabilities Stockholders' equity Common stock, no par Preferred stock, $50 par Paid-in capital in excess of par-Preferre Total paid-In capital Retained earnings Less: Treasury stock Total stockholders' equity Total liabilities and stockholders' equity 38,400 229,700 204,400 472,500 $ 68,100 252,200 102,200 422,500 242,200 112,400 36,400 391,000 380,700 38,000 733,700 $1,206,200 202,400 102,400 30,400 335,200 288,500 (68,000 555,700 $ 978,200 Cash flows from investing activities: The following financial statements and information are available for Solomon Industries Inc. Balance Sheets As of December 31 Year 3 Year 2 162,480 105,300 188,100 294,700 681,400 (307,700) 82,000 1,206,200 $ 122,600 86,800 173,800 222,000 492,500 (237,900) 118,400 978, 200 Assets Cash Accounts receivable Inventory Marketable securities (available for sale) Equipment Accumulated depreciation Land Total assets Liabilities and equity Liabilities Accounts payable (inventory) Notes payable-Long-term Bonds payable Total liabilities Stockholders' equity Common stock, no par Preferred stock, $50 par Paid-in capital in excess of par-Preferre Total paid-In capital Retained earnings Less: Treasury stock Total stockholders' equity Total liabilities and stockholders' equity 38,400 229,700 204,400 472,500 $ 68,100 252,200 102,200 422,500 242,200 112,400 36,400 391,000 380,700 38,000 733,700 $1,206,200 202,400 102,400 30,400 335,200 288,500 (68,000 555,700 $ 978,200 Cash flows from investing activities
Answer & Explanation
Solved by verified expert
Get Answers to Unlimited Questions
Join us to gain access to millions of questions and expert answers. Enjoy exclusive benefits tailored just for you!
Membership Benefits:
Unlimited Question Access with detailed Answers
Zin AI - 3 Million Words
10 Dall-E 3 Images
20 Plot Generations
Conversation with Dialogue Memory
No Ads, Ever!
Access to Our Best AI Platform: Zin AI - Your personal assistant for all your inquiries!