The figure below shows the normal pattern of chromosomal separation during Meiosis I and M...
80.2K
Verified Solution
Link Copied!
Question
Biology
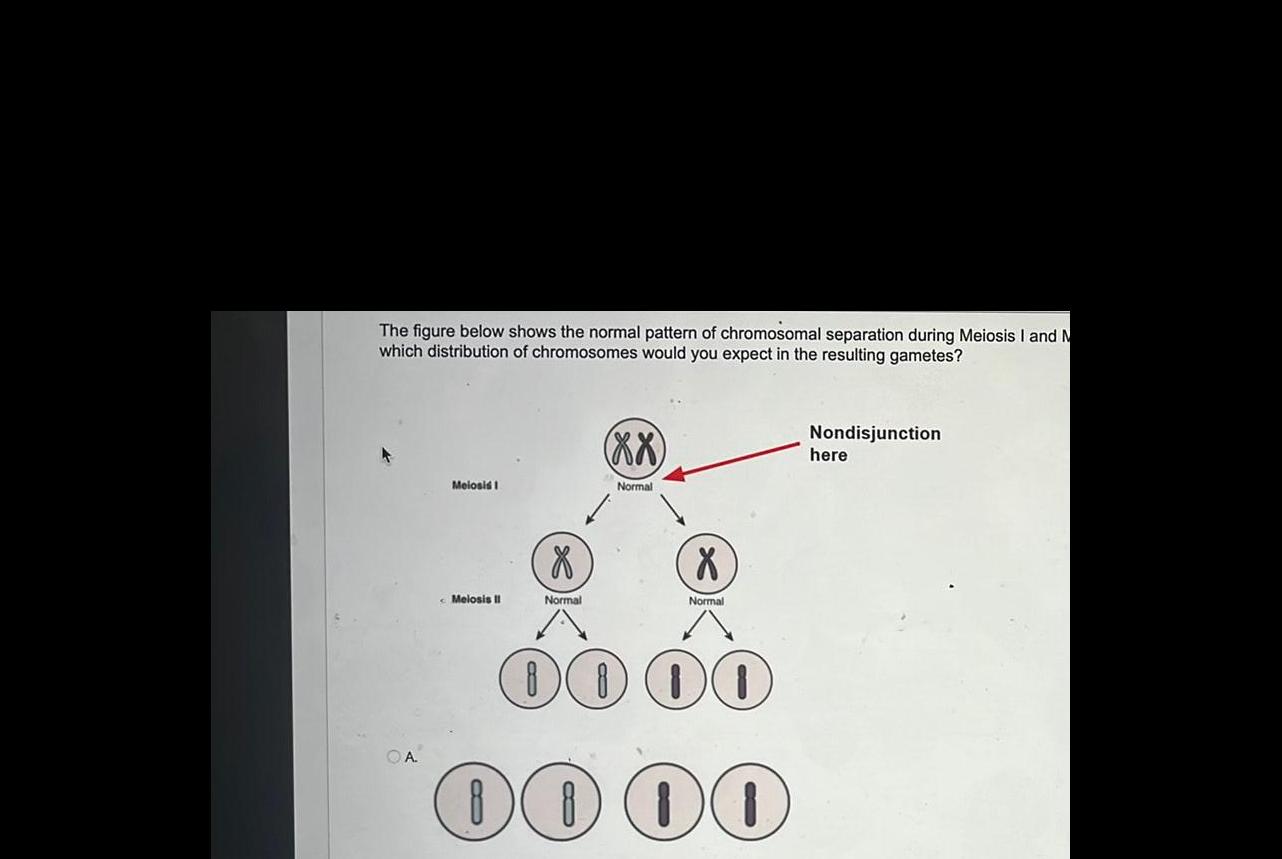
The figure below shows the normal pattern of chromosomal separation during Meiosis I and M which distribution of chromosomes would you expect in the resulting gametes Melosis I Melosis II X Normal XX Normal X Normal 00 00 00 00 Nondisjunction here
Answer & Explanation
Solved by verified expert
Get Answers to Unlimited Questions
Join us to gain access to millions of questions and expert answers. Enjoy exclusive benefits tailored just for you!
Membership Benefits:
Unlimited Question Access with detailed Answers
Zin AI - 3 Million Words
10 Dall-E 3 Images
20 Plot Generations
Conversation with Dialogue Memory
No Ads, Ever!
Access to Our Best AI Platform: Zin AI - Your personal assistant for all your inquiries!