Required: 1. The graph displays, for more than 148,000 company-years, each companys net income divided...
90.2K
Verified Solution
Link Copied!
Question
Accounting
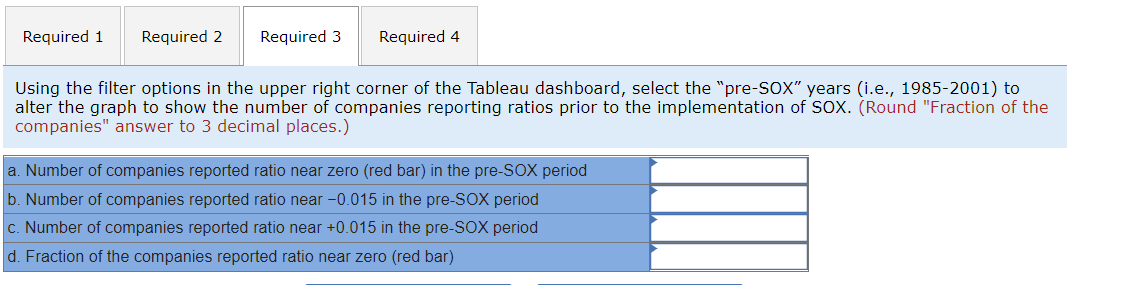
Required:1. The graph displays, for more than 148,000 company-years, each companys net income divided by total stockholders equity. By what name is this ratio known? 2. Select the statement that appropriately explains why the graph suggests evidence of earnings management. 3. Using the filter options in the upper right corner of the Tableau dashboard, select the pre-SOX years (i.e., 1985-2001) to alter the graph to show the number of companies reporting ratios prior to the implementation of SOX.
How many companies reported a ratio near zero (red bar) in the pre-SOX period?
How many companies reported a ratio near 0.015 in the pre-SOX period?
How many companies reported a ratio near +0.015 in the pre-SOX period?
Divide your answer in 3a by the total of your answers to 3a-3c. What fraction of the companies in 3a-3c reported a ratio near zero (red bar)?
4. Using the filter options in the upper right corner of the Tableau dashboard, select the post-SOX years (i.e., 2003-2017) to alter the graph to show the number of companies reporting ratios after the implementation of SOX.
How many companies reported a ratio near zero (red bar) in the post-SOX period?
How many companies reported a ratio near 0.015 in the post-SOX period?
How many companies reported a ratio near +0.015 in the post-SOX period?
Divide your answer in 4a by the total of your answers to 4a-4c. What fraction of the companies in 4a-4c reported a ratio near zero (red bar)?
Do your answers in 3d and 4d suggest SOX encouraged a greater proportion of companies to honestly report near-zero earnings?
The Sarbanes-Oxley Act of 2002 (SOX) was created, in part, to address cases of companies making fraudulent entries to avoid reporting net losses. To find evidence of this kind of earnings management, review the below Tableau dashboard, which includes available data from all U.S. public companies for 1985-2017 (except banks, financial institutions, and other regulated companies). By following the requirements below, you will discover whether earnings management occurred during certain periods. Required: 1. The graph displays, for more than 148,000 company-years, each company's net income divided by total stockholders' equity. By what name is this ratio known? 2. Select the statement that appropriately explains why the graph suggests evidence of earnings management. 3. Using the filter options in the upper right corner of the Tableau dashboard, select the "pre-SOX" years (i.e., 1985-2001) to alter the graph to show the number of companies reporting ratios prior to the implementation of SOX. a. How many companies reported a ratio near zero (red bar) in the pre-SOX period? b. How many companies reported a ratio near 0.015 in the pre-SOX period? c. How many companies reported a ratio near +0.015 in the pre-SOX period? d. Divide your answer in 3a by the total of your answers to 3a-3c. What fraction of the companies in 3a-3c reported a ratio near zero (red bar)? 4. Using the filter options in the upper right corner of the Tableau dashboard, select the "post-SOX" years (i.e., 2003-2017) to alter the graph to show the number of companies reporting ratios after the implementation of SOX. a. How many companies reported a ratio near zero (red bar) in the post-SOX period? b. How many companies reported a ratio near 0.015 in the post-SOX period? c. How many companies reported a ratio near +0.015 in the post-SOX period? d. Divide your answer in 4a by the total of your answers to 4a-4c. What fraction of the companies in 4a-4c reported a ratio near zero (red bar)? e. Do your answers in 3d and 4d suggest SOX encouraged a greater proportion of companies to honestly report near-zero earnings? Complete this question by entering your answers in the tabs below. The graph displays, for more than 148,000 company-years, each company's net income divided by total stockholders' equity. By what name is this ratio known? Select the statement that appropriately explains why the graph suggests evidence of earnings management. The number of companies reporting a ratio near zero (red bar) is smaller than expected, given the number of companies reporting lightly more negative (0.015) and slightly more positive (0.015) ratios. The total number of companies reporting a positive ratio is greater than the total number of companies reporting a negative ratio. The total number of companies reporting a negative ratio is greater than the total number of companies reporting a positive ratio. None of the above. Using the filter options in the upper right corner of the Tableau dashboard, select the "pre-SOX" years (i.e., 1985-2001) to alter the graph to show the number of companies reporting ratios prior to the implementation of SOX. (Round "Fraction of the companies" answer to 3 decimal places.) Using the filter options in the upper right corner of the Tableau dashboard, select the "post-SOX" years (i.e., 2003-2017) to alter the graph to sh the number of companies reporting ratios after the implementation of SOX. (Round "Fraction of the companies" answer to 3 decimal places.) The Sarbanes-Oxley Act of 2002 (SOX) was created, in part, to address cases of companies making fraudulent entries to avoid reporting net losses. To find evidence of this kind of earnings management, review the below Tableau dashboard, which includes available data from all U.S. public companies for 1985-2017 (except banks, financial institutions, and other regulated companies). By following the requirements below, you will discover whether earnings management occurred during certain periods. Required: 1. The graph displays, for more than 148,000 company-years, each company's net income divided by total stockholders' equity. By what name is this ratio known? 2. Select the statement that appropriately explains why the graph suggests evidence of earnings management. 3. Using the filter options in the upper right corner of the Tableau dashboard, select the "pre-SOX" years (i.e., 1985-2001) to alter the graph to show the number of companies reporting ratios prior to the implementation of SOX. a. How many companies reported a ratio near zero (red bar) in the pre-SOX period? b. How many companies reported a ratio near 0.015 in the pre-SOX period? c. How many companies reported a ratio near +0.015 in the pre-SOX period? d. Divide your answer in 3a by the total of your answers to 3a-3c. What fraction of the companies in 3a-3c reported a ratio near zero (red bar)? 4. Using the filter options in the upper right corner of the Tableau dashboard, select the "post-SOX" years (i.e., 2003-2017) to alter the graph to show the number of companies reporting ratios after the implementation of SOX. a. How many companies reported a ratio near zero (red bar) in the post-SOX period? b. How many companies reported a ratio near 0.015 in the post-SOX period? c. How many companies reported a ratio near +0.015 in the post-SOX period? d. Divide your answer in 4a by the total of your answers to 4a-4c. What fraction of the companies in 4a-4c reported a ratio near zero (red bar)? e. Do your answers in 3d and 4d suggest SOX encouraged a greater proportion of companies to honestly report near-zero earnings? Complete this question by entering your answers in the tabs below. The graph displays, for more than 148,000 company-years, each company's net income divided by total stockholders' equity. By what name is this ratio known? Select the statement that appropriately explains why the graph suggests evidence of earnings management. The number of companies reporting a ratio near zero (red bar) is smaller than expected, given the number of companies reporting lightly more negative (0.015) and slightly more positive (0.015) ratios. The total number of companies reporting a positive ratio is greater than the total number of companies reporting a negative ratio. The total number of companies reporting a negative ratio is greater than the total number of companies reporting a positive ratio. None of the above. Using the filter options in the upper right corner of the Tableau dashboard, select the "pre-SOX" years (i.e., 1985-2001) to alter the graph to show the number of companies reporting ratios prior to the implementation of SOX. (Round "Fraction of the companies" answer to 3 decimal places.) Using the filter options in the upper right corner of the Tableau dashboard, select the "post-SOX" years (i.e., 2003-2017) to alter the graph to sh the number of companies reporting ratios after the implementation of SOX. (Round "Fraction of the companies" answer to 3 decimal places.)
Answer & Explanation
Solved by verified expert
Get Answers to Unlimited Questions
Join us to gain access to millions of questions and expert answers. Enjoy exclusive benefits tailored just for you!
Membership Benefits:
Unlimited Question Access with detailed Answers
Zin AI - 3 Million Words
10 Dall-E 3 Images
20 Plot Generations
Conversation with Dialogue Memory
No Ads, Ever!
Access to Our Best AI Platform: Flex AI - Your personal assistant for all your inquiries!