Relations between Financial Statements s. Prepare an analysis that explains the change in retained earnings...
90.2K
Verified Solution
Link Copied!
Question
Accounting
Relations between Financial Statements
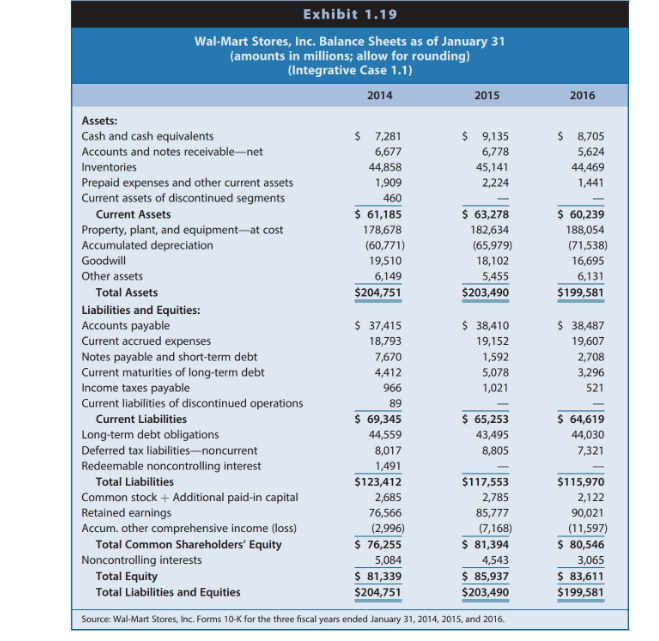
s. Prepare an analysis that explains the change in retained earnings from $85,777 million at the end of fiscal 2014 to $90,021 million at the end of fiscal 2015. Do not be alarmed if your reconciliation is close to, but does not exactly equal, the $90,021 million ending balance.
Exhibit 1.19 Wal-Mart Stores, Inc. Balance Sheets as of January 31 (amounts in millions; allow for rounding) (Integrative Case 1.1) 2014 2015 2016 $ $ 9,135 6,778 45,141 2,224 8,705 5,624 44,469 1,441 $ 7,281 6,677 44,858 1,909 460 $ 61,185 178,678 (60,771) 19,510 6,149 $204,751 $ 63,278 182,634 (65,979) 18,102 5,455 $203,490 $ 60,239 188,054 (71,538) 16,695 6,131 $199,581 Assets: Cash and cash equivalents Accounts and notes receivable-net Inventories Prepaid expenses and other current assets Current assets of discontinued segments Current Assets Property, plant, and equipment--at cost Accumulated depreciation Goodwill Other assets Total Assets Liabilities and Equities: Accounts payable Current accrued expenses Notes payable and short-term debt Current maturities of long-term debt Income taxes payable Current liabilities of discontinued operations Current Liabilities Long-term debt obligations Deferred tax liabilities-noncurrent Redeemable noncontrolling interest Total Liabilities Common stock + Additional paid-in capital Retained earnings Accum. other comprehensive income (loss) Total Common Shareholders' Equity Noncontrolling interests Total Equity Total Liabilities and Equities $ 38,410 19,152 1,592 5,078 1,021 $ 38,487 19,607 2,708 3,296 521 $ 65,253 43,495 8,805 $ 64,619 44,030 7,321 $ 37,415 18,793 7,670 4,412 966 89 $ 69,345 44,559 8,017 1,491 $123,412 2,685 76,566 (2,996) $ 76,255 5,084 $ 81,339 $204,751 $117,553 2,785 85,777 (7,168) $ 81,394 4,543 $ 85,937 $203,490 $115,970 2,122 90,021 (11,597) $ 80,546 3,065 $ 83,611 $199,581 Source: Wal-Mart Stores, Inc. Forms 10-K for the three fiscal years ended January 31, 2014, 2015, and 2016. Wal-Mart Stores, Inc. Income Statements for the Fiscal Years Ended January 31 (amounts in millions; allow for rounding) (Integrative Case 1.1) 2014 2015 2016 $ 482,130 360,984 $121,146 97,041 $ 24,105 Revenues Cost of goods sold Gross Profit Selling, general, and administrative expenses Operating Profit Interest income Interest expense Income before Tax Income tax expense Income (Loss) from discontinued operations Net Income Net income attributable to noncontrolling interests Net Income Attributable to Common Shareholders Other comprehensive income items Comprehensive Income $ 485,651 365,086 $120,565 93,418 $ 27,147 113 (2,461) $ 24,799 7,985 81 $ 476,294 358,069 $118,225 91,353 $ 26,872 119 (2,335) $ 24,656 8,105 144 $ 16,695 (673) $ 16,022 (2,409) $ 13,613 (2,548) $ 21,638 6,558 285 $ 17,099 (736) $ 16,363 (4,172) $ 12,191 $ 15,080 (386) $ 14,694 (4,429) $ 10,265 Source: Wal-Mart Stores, Inc. Forms 10-K for the three fiscal years ended January 31, 2014, 2015, and 2016 Exhibit 1.21 Wal-Mart Stores, Inc. Statements of Cash Flows for the Three Fiscal Years Ended January 31 (amounts in millions; allow for rounding) (Integrative Case 1.1) 2014 2015 2016 Net Income Add back depreciation and amortization expenses Deferred income taxes (Increase) Decrease in accounts receivable (Increase) Decrease in inventories Increase (Decrease) in accounts payable Increase (Decrease) in income taxes payable Increase (Decrease) in other current liabilities (Income) Loss from discontinued segments Other operating cash flows Net Cash Flow from Operating Activities $ 16,695 8,870 (279) (566) (1,667) 531 (1,224) 103 (144) 938 $ 23,257 $ 17,099 9,173 (503) (569) (1,229) 2,678 166 1,249 (285) 785 $ 28,564 $ 15,080 9,454 (672) (19) (703) 2,008 (472) 1,303 1,410 $ 27,389 Exhibit 1.21 (Continued) 570 727 (13,115) (12,174) 635 (11,477) Proceeds from sales of property, plant, and equipment Property, plant, and equipment acquired Investments acquired Other investment transactions Net Cash Flow from Investing Activities Increase (Decrease) in short-term borrowing Increase (Decrease) in long-term borrowing Share repurchases-treasury stock Dividend payments Other financing activities Net Cash Flow from Financing Activities Effects of exchange rate changes on cash Net Change in Cash Cash and cash equivalents, beginning of year Cash and cash equivalents, end of year (138) $(12,526) 911 2,104 (6,683) (6,139) (982) $(10,789) (442) $ (500) $ 7,781 $ 7,281 479 $(11,125) (6,288) 1,270 (1,015) (6,185) (2,853) $(15,071) (514) $ 1,854 $ 7,281 $ 9,135 167 $(10,675) 1,235 (4,393) (4,112) (6,294) (2,558) $(16,122) (1,022) $ (430) $ 9,135 $ 8,705 Source: Wal-Mart Stores, Inc. Forms 10-K for the three fiscal years ended January 31, 2014, 2015, and 2016. Relations between Financial Statements s. Prepare an analysis that explains the change in retained earnings from $85,777 million at the end of fiscal 2014 to $90,021 million at the end of fiscal 2015. Do not be alarmed if your rec onciliation is close to, but does not exactly equal, the $90,021 million ending balance. Interpreting Financial Statement Relations Exhibit 1.22 presents common-size and percentage change balance sheets and Exhibit 1.23 presents common size and percentage change income statements for Walmart for fiscal years ended January 31, 2014, 2015, and 2106. The percentage change statements report the annual percentage change in each account from fiscal 2013 to 2014, and from fiscal 2014 to 2015. Exhibit 1.22 Wal-Mart Stores, Inc. Common-Size and Percentage Change Balance Sheets as of January 31 (allow for rounding) (Integrative Case 1.1) Common Size 2014 2015 2016 Percentage Change 2015 2016 Assets: Cash and cash equivalents Accounts and notes receivable-net Inventories Prepaid expenses and other current assets Current assets of discontinued segments Current Assets Property, plant, and equipmentat cost Accumulated depreciation Goodwill Other assets Total Assets Liabilities and Equities: Accounts payable Current accrued expenses Notes payable and short-term debt Current maturities of long-term debt 3.6% 3.3% 21.9% 0.9% 0.2% 29.9% 87.3% (29.7%) 9.5% 3.0% 100.0% 4.5% 3.3% 22.2% 1.1% 0.0% 31.1% 89.8% (32.496) 8.9% 2.796 100.0% 4.4% 2.8% 22.3% 0.7% 0.0% 30.2% 94.2% (35.8%) 8.4% 3.1% 100.0% 25.5% 1.5% 0.6% 16.5% (100.0%) 3.4% 2.2% 8.6% (7.2%) (11.3%) (0.6%) (4.7) (17.0%) (1.5%) (35.2%) na (4.8%) 3.0% 8.4% (7.8%) 12.4% (1.9%) 18.3% 9.2% 3.7% 2.2% 18.99 9.4% 0.8% 2.5% 19.3% 9.8% 1.4% 1.7% 2.7% 1.9% (79.2%) 15.1% 0.2% 2.4% 70.1% (35.19)
Answer & Explanation
Solved by verified expert
Get Answers to Unlimited Questions
Join us to gain access to millions of questions and expert answers. Enjoy exclusive benefits tailored just for you!
Membership Benefits:
Unlimited Question Access with detailed Answers
Zin AI - 3 Million Words
10 Dall-E 3 Images
20 Plot Generations
Conversation with Dialogue Memory
No Ads, Ever!
Access to Our Best AI Platform: Zin AI - Your personal assistant for all your inquiries!