Problem 4-32 (Part Level Submission) Sunland Wings, Inc. manufactures airplanes for use in stunt shows....
60.1K
Verified Solution
Link Copied!
Question
Accounting
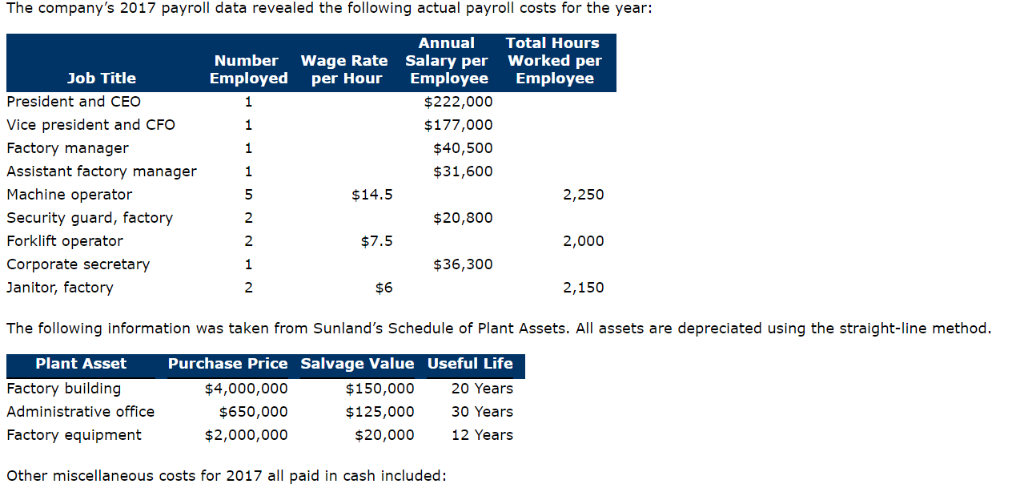
Problem 4-32 (Part Level Submission) Sunland Wings, Inc. manufactures airplanes for use in stunt shows. Sunland's factory is highly automated, using the latest in robotic technology. To keep costs low, the company employs as few factory workers as possible. Since each plane has different features (such as its shape, weight, and color), Sunland uses a job order costing system to accumulate product costs. At the end of 2016, Sunland's accountants developed the following expectations for 2017 based on the marketing department's sales forecast: Budgeted overhead cost Estimated machine hours Estimated direct labor hours Estimated direct materials cost $1,125,000 47,000 10,000 $1,500,000 Sunland's inventory count, completed on December 31, 2016, revealed the following ending inventory balances: Raw Materials Inventory Work in Process Inventory Finished Goods Inventory $249,000 $625,000 $1,560,000 The company's 2017 payroll data revealed the following actual payroll costs for the year: The company's 2017 payroll data revealed the following actual payroll costs for the year: Job Title President and CEO Vice president and CFO Factory manager Assistant factory manager Machine operator Security guard, factory Forklift operator Corporate secretary Janitor, factory Annual Total Hours Number Wage Rate Salary per Worked per Employed per Hour Employee Employee $222,000 $177,000 $40,500 $31,600 5 $14.5 2,250 2 $20,800 $7.5 2,000 $36,300 2,150 The following information was taken from Sunland's Schedule of Plant Assets. All assets are depreciated using the straight-line method. Plant Asset Factory building Administrative office Factory equipment Purchase Price Salvage Value Useful Life $4,000,000 $150,000 20 Years $650,000 $125,000 30 Years $2,000,000 $20,000 12 Years Other miscellaneous costs for 2017 all paid in cash included: Other miscellaneous costs for 2017 all paid in cash included: Cost Amount Factory Insurance (fully expired) $13,300 Administrative office utilities $5,900 Factory utilities $32,800 Office supplies (fully consumed) $5,000 ces Additional information about Sunland's operations in 2017 includes the following: Raw materials purchases for the year amounted to $1,949,000. All materials were purchased on account. The company used $1,860,000 in raw materials during the year. Of that amount, 85% was direct materials and 15% was indirect materials. Sunland applied overhead to Work in Process Inventory based on direct materials cost. Airplanes costing $3,450,000 to manufacture were completed and transferred out of Work in Process Inventory. Sunland uses a markup of 80% to price its airplanes. Sales for the year were $6,570,000. All sales are made on account. (Note: This transaction requires two journal entries.) No. Account Titles and Explanation Debit Credit Salaries and Wages Expense 435300 Salaries Payable 435300 (To record salaries for president, vice president, and corpoarte secretary) 2. Manufacturing Overhead 13700 Salaries Payable 113700 (To record salaried factory worker costs) 3. Work in Process Inventory | 16 63125 Manufacturing Overhead | 55800 Wages Payable 218925 (To record hourly factory worker costs) 4, ]Depreciation Expense 7500 Accumulated Depreciation _17500 (To record depreciation on administrative office equipment) 5. Manufacturing Overhead 357500 57500 Accumulated Depreciation ed Depreciation (To record depreciation on factory building and equipment) 6. Toffice Utilities 6. 5900 Office Supplies 5000 Cash I 10900 (To record administrative office utilities and office supplies expense) 7. Manufacturing Overhead 46100 Cash 46100 (To record factory insurance and factory utilities) 8. Raw Materials Inventory y 19 49000 Accounts Payable 1949000 (To record raw materials purchases) 9. TWork in Process Inventory tory 1581000 Manufacturing Overhead 279000 Raw Materials Inventory 1860000 (To record direct materials and indirect materials used in production) F 10. Work in Process Inventory 11 1185750 Manufacturing Overhead 1185750 (To apply overhead to work in process) 11. Finished Goods Inventory 3450000 Work in Process Inventory TEL 3450000 (To record transfer of completed airplanes) 12. Taccounts Receivable 16570 000 Sales Revenue 6570000 (To record sale of airplanes to customers) ( ccor Sale UI an pianis L CUSLUITICIS) 13. Cost of Goods Sold J 3650000 Finished Goods Inventory 3650000 (To record cost of airplanes sold) (C) Prepare the appropriate T-accounts for Raw Materials Inventory, Sold, and Sales, and record Sunland's transactions for 2017. (PO Raw Materials 249000 Bal. -|| (8) Bal. | 1949000 (9) 1860000 Work in Process Inventory (11) 3450000 Bal. (3) (9) (10) 625000 163125 1581000 1185750 Bal. v Finished Goods Inventory Bal. 1560000 (11) 3450000 (13) 3650000 Bal. Manufacturing Overhead (2) 113700 (10) 55800 (3) 1 (5) 357500 (7) 46100 (9) 279000 Bal. Cost of Goods Sold (13) 3650000 Sales Revenue (12) 6570000
Answer & Explanation
Solved by verified expert
Get Answers to Unlimited Questions
Join us to gain access to millions of questions and expert answers. Enjoy exclusive benefits tailored just for you!
Membership Benefits:
Unlimited Question Access with detailed Answers
Zin AI - 3 Million Words
10 Dall-E 3 Images
20 Plot Generations
Conversation with Dialogue Memory
No Ads, Ever!
Access to Our Best AI Platform: Zin AI - Your personal assistant for all your inquiries!