Please help me understand how to do Amazon's competitor, Walmart. Also I forgot to change...
70.2K
Verified Solution
Link Copied!
Question
Accounting
Please help me understand how to do Amazon's competitor, Walmart. Also I forgot to change retail industry to e-commerce industry. Can you explain how to do that one as well.
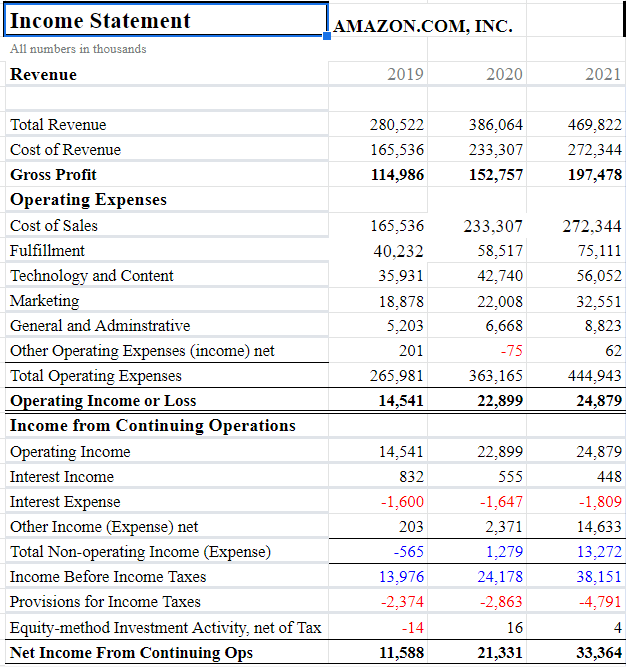
CLC - The Financial Statement Analysis Report: Liquidity and Solvency Analysis Assessment Description This is a Collaborative Learning Community (CLC) assignment. The purpose of this assignment is to measure a company's financial health by analyzing liquidity and solvency ratios. Liquidity and solvency ratios serve as important references for a company's capacity to meet both short-term and longterm financial obligations, and is generally indicative of a company's ability to quickly generate cash. Utilizing the company's annual report, refer to the Notes to the Financial Statements and analyze the company's financial statements for the last 3 years. Part 1: Liquidity and Solvency Ratios (3 Person Team) In the Ratios tab of the FSAR Excel Spreadsheet, complete the Short-Term Debt Paying Ratios, Asset Utilization or Turnover Ratios, and the Long-Term Solvency or Financial Leverage sections. 1. Calculate of the short-term debt paying ratios. 2. Calculate the long-term debt paying or financial leverage ratios. 3. Calculate the five significant asset utilization or turnover ratios. Address the following analysis questions in the Comments section of each ratio: 1. What accounts changed for the period and how did this affect the financial analysis calculation? 2. Why did the account change during the period? Explain what business decisions may have caused the change. 3. How does this change influence the company's performance? The CLC group will submit the FSAR Excel Spreadsheet with the analyzed data for the selected company. To earn full credit on this assignment, the group must show detailed work in Excel, which includes providing the formulas and comments in the cells, not just the summary value, APA style is not required, but solid academic writing is expected. You are not required to submit this part of the assignment to LopesWrite. Nonrecurring Events \begin{tabular}{|l|r|r|r|} \hline Discontinued Operations & & & \\ \hline Extraordinary Items & & & \\ \hline Effect of Accounting Changes & & & \\ \hline Other Items & & & \\ \hline Net Income & 11,588 & 21,331 & 33,364 \\ \hline Net Income & 11,588 & 21,331 & 33,364 \\ \hline Preferred Stock and Other Adjustments & & & \\ \hline Net Income Applicable to Common Shares & 11,588 & 21,331 & 33,364 \\ \hline \end{tabular} \begin{tabular}{|l|r|r|r|} \hline \multicolumn{1}{|l|}{ Balance Sheet } & & & \\ \hline All numbers in thousands & & & \\ \hline Period Ending & 2019 & 2020 & 2021 \\ \hline Current Assets & & & \\ \hline Cash and Cash Equivalents & 36,092 & 42,122 & 36,220 \\ \hline Marketable Securities & 18,929 & 42,274 & 59,829 \\ \hline Inventories & 20,497 & 23,795 & 32,640 \\ \hline Accounts Receivable, net and other & 20,816 & 24,542 & 32,891 \\ \hline Total Current Assets & 96,334 & 132,733 & 161,580 \\ \hline \hline Property Plant and Equipment & 72,705 & 113,114 & 160,281 \\ \hline Operating Leases & 25,141 & 37,553 & 56,082 \\ \hline Goodwill & 14,754 & 15,017 & 15,371 \\ \hline Other Assets & 16,314 & 22,778 & 27,235 \\ \hline Total Assets & 225,248 & 321,195 & 420,549 \\ \hline Current Liabilities & & & \\ \hline Accounts Payable & 47,183 & 72,539 & 78,664 \\ \hline Accrued Expenses and Other & 32,439 & 44,138 & 51,775 \\ \hline Unearned Revenue & 8,190 & 9,708 & 11,827 \\ \hline Total Current Liabilities & 87,812 & 126,385 & 142,266 \\ \hline \hline Long-Term Lease Liabilities & 39,791 & 52,573 & 67,651 \\ \hline Long-Term Debt & 23,414 & 31,816 & 48,744 \\ \hline Other Long-term Liabilities & 12,171 & 17,017 & 23,643 \\ \hline Total Liabilities & 163,188 & 227,791 & 282,304 \\ \hline \end{tabular} Stockholders' Equity \begin{tabular}{|l|r|r|r|} \hline Outstanding Shares & 5 & 5 & 5 \\ \hline Treasury Stock, at cost & 1,837 & 1,837 & 1,837 \\ \hline Additional Paid-in Capital & 33,658 & 42,865 & 55,538 \\ \hline Retained Earnings & 31,220 & 52,551 & 85,915 \\ \hline Accumilated Other & 986 & 180 & 1,376 \\ \hline Comprehensive Income (Loss) & & & \\ \hline Total Stockholder Equity & 62,060 & 93,404 & 138,245 \\ \hline \hline Net Tangible Assets & 47,306 & 78,387 & 122,874 \\ \hline \end{tabular} Profitability Ratios Net Profit Margin Ratio Total Asset Turnover Return on Assets Operating Income Margin Sales to Fixed Assets ROE Return on Common Equity Gross Profit Margin Investor Ratios Degree of Financial Leverage Earnings per Share Diluted Earnings per Share Price/Earnings Ratio Percentage of Earnings Retained Dividend Payout Dividend Yield CLC - The Financial Statement Analysis Report: Liquidity and Solvency Analysis Assessment Description This is a Collaborative Learning Community (CLC) assignment. The purpose of this assignment is to measure a company's financial health by analyzing liquidity and solvency ratios. Liquidity and solvency ratios serve as important references for a company's capacity to meet both short-term and longterm financial obligations, and is generally indicative of a company's ability to quickly generate cash. Utilizing the company's annual report, refer to the Notes to the Financial Statements and analyze the company's financial statements for the last 3 years. Part 1: Liquidity and Solvency Ratios (3 Person Team) In the Ratios tab of the FSAR Excel Spreadsheet, complete the Short-Term Debt Paying Ratios, Asset Utilization or Turnover Ratios, and the Long-Term Solvency or Financial Leverage sections. 1. Calculate of the short-term debt paying ratios. 2. Calculate the long-term debt paying or financial leverage ratios. 3. Calculate the five significant asset utilization or turnover ratios. Address the following analysis questions in the Comments section of each ratio: 1. What accounts changed for the period and how did this affect the financial analysis calculation? 2. Why did the account change during the period? Explain what business decisions may have caused the change. 3. How does this change influence the company's performance? The CLC group will submit the FSAR Excel Spreadsheet with the analyzed data for the selected company. To earn full credit on this assignment, the group must show detailed work in Excel, which includes providing the formulas and comments in the cells, not just the summary value, APA style is not required, but solid academic writing is expected. You are not required to submit this part of the assignment to LopesWrite. Nonrecurring Events \begin{tabular}{|l|r|r|r|} \hline Discontinued Operations & & & \\ \hline Extraordinary Items & & & \\ \hline Effect of Accounting Changes & & & \\ \hline Other Items & & & \\ \hline Net Income & 11,588 & 21,331 & 33,364 \\ \hline Net Income & 11,588 & 21,331 & 33,364 \\ \hline Preferred Stock and Other Adjustments & & & \\ \hline Net Income Applicable to Common Shares & 11,588 & 21,331 & 33,364 \\ \hline \end{tabular} \begin{tabular}{|l|r|r|r|} \hline \multicolumn{1}{|l|}{ Balance Sheet } & & & \\ \hline All numbers in thousands & & & \\ \hline Period Ending & 2019 & 2020 & 2021 \\ \hline Current Assets & & & \\ \hline Cash and Cash Equivalents & 36,092 & 42,122 & 36,220 \\ \hline Marketable Securities & 18,929 & 42,274 & 59,829 \\ \hline Inventories & 20,497 & 23,795 & 32,640 \\ \hline Accounts Receivable, net and other & 20,816 & 24,542 & 32,891 \\ \hline Total Current Assets & 96,334 & 132,733 & 161,580 \\ \hline \hline Property Plant and Equipment & 72,705 & 113,114 & 160,281 \\ \hline Operating Leases & 25,141 & 37,553 & 56,082 \\ \hline Goodwill & 14,754 & 15,017 & 15,371 \\ \hline Other Assets & 16,314 & 22,778 & 27,235 \\ \hline Total Assets & 225,248 & 321,195 & 420,549 \\ \hline Current Liabilities & & & \\ \hline Accounts Payable & 47,183 & 72,539 & 78,664 \\ \hline Accrued Expenses and Other & 32,439 & 44,138 & 51,775 \\ \hline Unearned Revenue & 8,190 & 9,708 & 11,827 \\ \hline Total Current Liabilities & 87,812 & 126,385 & 142,266 \\ \hline \hline Long-Term Lease Liabilities & 39,791 & 52,573 & 67,651 \\ \hline Long-Term Debt & 23,414 & 31,816 & 48,744 \\ \hline Other Long-term Liabilities & 12,171 & 17,017 & 23,643 \\ \hline Total Liabilities & 163,188 & 227,791 & 282,304 \\ \hline \end{tabular} Stockholders' Equity \begin{tabular}{|l|r|r|r|} \hline Outstanding Shares & 5 & 5 & 5 \\ \hline Treasury Stock, at cost & 1,837 & 1,837 & 1,837 \\ \hline Additional Paid-in Capital & 33,658 & 42,865 & 55,538 \\ \hline Retained Earnings & 31,220 & 52,551 & 85,915 \\ \hline Accumilated Other & 986 & 180 & 1,376 \\ \hline Comprehensive Income (Loss) & & & \\ \hline Total Stockholder Equity & 62,060 & 93,404 & 138,245 \\ \hline \hline Net Tangible Assets & 47,306 & 78,387 & 122,874 \\ \hline \end{tabular} Profitability Ratios Net Profit Margin Ratio Total Asset Turnover Return on Assets Operating Income Margin Sales to Fixed Assets ROE Return on Common Equity Gross Profit Margin Investor Ratios Degree of Financial Leverage Earnings per Share Diluted Earnings per Share Price/Earnings Ratio Percentage of Earnings Retained Dividend Payout Dividend Yield
Answer & Explanation
Solved by verified expert
Get Answers to Unlimited Questions
Join us to gain access to millions of questions and expert answers. Enjoy exclusive benefits tailored just for you!
Membership Benefits:
Unlimited Question Access with detailed Answers
Zin AI - 3 Million Words
10 Dall-E 3 Images
20 Plot Generations
Conversation with Dialogue Memory
No Ads, Ever!
Access to Our Best AI Platform: Zin AI - Your personal assistant for all your inquiries!