Please answer question (d) F G H J Expected Monthly Return Expected Monthly...
80.2K
Verified Solution
Question
Finance


Please answer question (d)
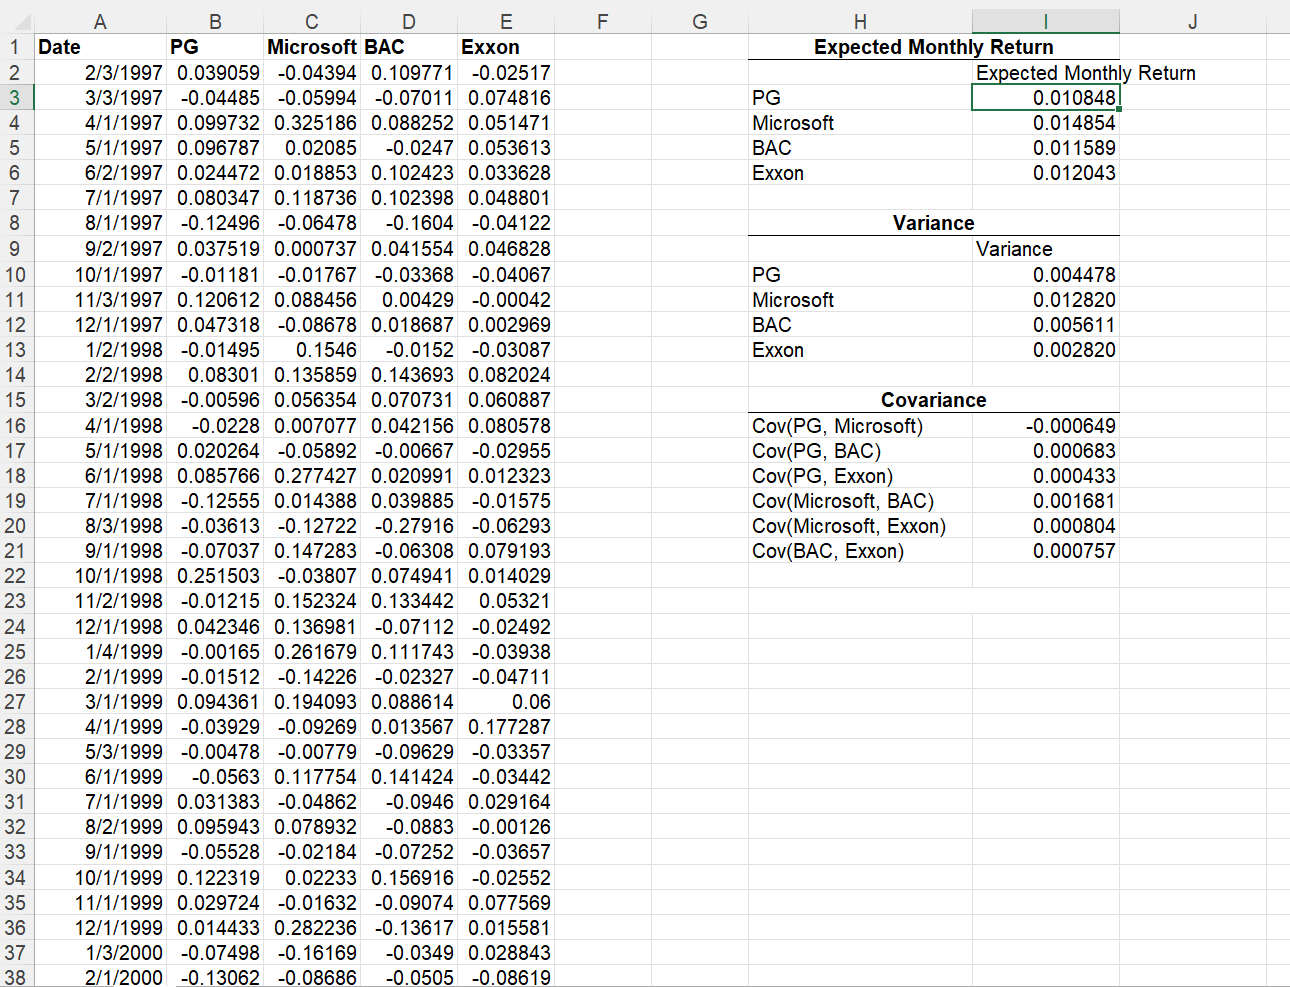
F G H J Expected Monthly Return Expected Monthly Return PG 0.010848) Microsoft 0.014854 BAC 0.011589 Exxon 0.012043 000 PG Microsoft BAC Exxon Variance Variance 0.004478 0.012820 0.005611 0.002820 A B D E 1 Date PG Microsoft BAC Exxon 2 2/3/1997 0.039059 -0.04394 0.109771 -0.02517 3 3/3/1997 -0.04485 -0.05994 -0.07011 0.074816 4 4/1/1997 0.099732 0.325186 0.088252 0.051471 5 5/1/1997 0.096787 0.02085 -0.0247 0.053613 6 6/2/1997 0.024472 0.018853 0.102423 0.033628 7 7/1/1997 0.080347 0.118736 0.102398 0.048801 8 8/1/1997 -0.12496 -0.06478 -0.1604 -0.04122 9 9/2/1997 0.037519 0.000737 0.041554 0.046828 10 10/1/1997 -0.01181 -0.01767 -0.03368 -0.04067 11 11/3/1997 0.120612 0.088456 0.00429 -0.00042 12 12/1/1997 0.047318 -0.08678 0.018687 0.002969 13 1/2/1998 -0.01495 0.1546 -0.0152 -0.03087 14 2/2/1998 0.08301 0.135859 0.143693 0.082024 15 3/2/1998 -0.00596 0.056354 0.070731 0.060887 16 4/1/1998 -0.0228 0.007077 0.042156 0.080578 17 5/1/1998 0.020264 -0.05892 -0.00667 -0.02955 18 6/1/1998 0.085766 0.277427 0.020991 0.012323 19 7/1/1998 -0.12555 0.014388 0.039885 -0.01575 20 8/3/1998 -0.03613 -0.12722 -0.27916 -0.06293 21 9/1/1998 -0.07037 0.147283 -0.06308 0.079193 22 10/1/1998 0.251503 -0.03807 0.074941 0.014029 23 11/2/1998 -0.01215 0.152324 0.133442 0.05321 24 12/1/1998 0.042346 0.136981 -0.07112 -0.02492 25 1/4/1999 -0.00165 0.261679 0.111743 -0.03938 26 2/1/1999 -0.01512 -0.14226 -0.02327 -0.04711 27 3/1/1999 0.094361 0.194093 0.088614 0.06 28 4/1/1999 -0.03929 -0.09269 0.013567 0.177287 29 5/3/1999 -0.00478 -0.00779 -0.09629 -0.03357 30 6/1/1999 -0.0563 0.117754 0.141424 -0.03442 31 7/1/1999 0.031383 -0.04862 -0.0946 0.029164 32 8/2/1999 0.095943 0.078932 -0.0883 -0.00126 33 9/1/1999 -0.05528 -0.02184 -0.07252 -0.03657 34 10/1/1999 0.122319 0.02233 0.156916 -0.02552 35 11/1/1999 0.029724 -0.01632 -0.09074 0.077569 36 12/1/1999 0.014433 0.282236 -0.13617 0.015581 37 1/3/2000 -0.07498 -0.16169 -0.0349 0.028843 2/1/2000 -0.13062 -0.08686 -0.0505 -0.08619 Covariance Cov(PG, Microsoft) Cov(PG, BAC) Cov(PG, Exxon) Cov(Microsoft, BAC) Cov(Microsoft, Exxon) Cov(BAC, Exxon) -0.000649 0.000683 0.000433 0.001681 0.000804 0.000757 38 39 40 41 42 43 44 45 46 47 48 49 50 51 52 53 54 55 56 57 58 59 60 61 62 63 64 65 66 67 68 69 70 71 72 73 74 75 76 77 78 79 80 81 82 83 84 85 86 A B C D E 3/1/2000 -0.35411 0.18888 0.15299 0.03557 4/3/2000 0.05783 -0.34365 -0.06549 -0.00378 5/1/2000 0.11303 -0.10304 0.14138 0.07814 6/1/2000 -0.1466 0.27882 -0.22424 -0.05781 7/3/2000 0.01039 -0.12728 0.10186 0.02149 8/1/2000 0.0848 0 0.14179 0.02378 9/1/2000 0.0837 -0.13608 -0.02243 0.09142 10/2/2000 0.07104 0.14176 -0.08226 0.00082 11/1/2000 0.0483 -0.16696 0.15732 -0.00845 12/1/2000 0.0477 -0.24374 0.14906 -0.0121 1/2/2001 -0.0799 0.40707 0.17254 -0.03201 2/1/2001 -0.01851 -0.03352 -0.04726 -0.03191 3/1/2001 -0.11214 -0.07308 0.07948 -0.00059 4/2/2001 -0.03476 0.23875 0.02298 0.09391 5/1/2001 0.06963 0.02122 0.06789 0.00652 6/1/2001 -0.00673 0.05528 0.01338 -0.01538 7/2/2001 0.1194 -0.09343 0.05991 -0.04386 8/1/2001 0.04408 -0.13802 -0.03338 -0.03326 9/4/2001 -0.01837 -0.1029 -0.0419 -0.01868 10/1/2001 0.01904 0.13613 0.01009 0.00121 11/1/2001 0.04994 0.10432 0.04044 -0.04648 12/3/2001 0.02148 0.03187 0.03567 0.05097 1/2/2002 0.03725 -0.0386 0.00132 -0.00633 2/1/2002 0.03794 -0.08413 0.02425 0.06396 3/1/2002 0.0625 0.03382 0.06371 0.06125 4/1/2002 0.00604 -0.13368 0.06556 -0.08349 5/1/2002 -0.00783 -0.02564 0.04596 -0.00029 6/3/2002 0.005 0.07416 -0.06427 0.02461 7/1/2002 0.00157 -0.12249 -0.0551 -0.10152 8/1/2002 -0.00392 0.02284 0.0538 -0.0296 9/3/2002 0.0084 -0.10868 -0.08106 -0.10003 10/1/2002 -0.00598 0.22216 0.09372 0.05503 11/1/2002 -0.04424 0.07882 0.00427 0.04076 12/2/2002 0.01671 -0.10389 0.00193 0.00398 1/2/2003 0.00027 -0.082 0.00694 -0.02248 2/3/2003 -0.04336 0.00205 -0.01186 0.00304 3/3/2003 0.08784 0.02152 -0.02517 0.02731 4/1/2003 0.01372 0.05617 0.10767 0.00722 5/1/2003 0.02196 -0.03751 0.00215 0.04138 6/2/2003 -0.02873 0.04193 0.07409 -0.01345 7/1/2003 -0.00977 0.02983 0.04465 -0.0092 8/1/2003 -0.00649 0.00414 -0.04019 0.0669 9/2/2003 0.06327 0.04853 -0.00532 -0.0294 10/1/2003 0.06418 -0.05459 -0.0294 -0.00031 11/3/2003 -0.02103 -0.01663 -0.00413 -0.0034 12/1/2003 0.038 0.06482 0.07777 0.13249 1/2/2004 0.0166 0.01015 0.01283 -0.00521 2/2/2004 0.01409 -0.04061 0.00538 0.04021 87 88 89 90 91 92 93 94 95 96 97 98 99 100 101 102 103 104 105 106 107 108 109 110 111 112 113 114 115 116 117 118 119 120 121 A B D E 3/1/2004 0.02316 -0.06008 -0.00157 -0.01377 4/1/2004 0.01358 0.04794 -0.00599 0.02309 5/3/2004 0.01914 0.00416 0.03269 0.02309 6/1/2004 0.00981 0.08836 0.02766 0.02693 7/1/2004 -0.03761 -0.00211 0.00478 0.04246 8/2/2004 0.07322 -0.03898 0.05833 0.00168 9/1/2004 -0.03301 0.01279 -0.027 0.04831 10/1/2004 -0.04987 0.01132 0.03353 0.01848 11/1/2004 0.04486 0.06845 0.033 0.04682 12/1/2004 0.03001 -0.00322 0.02572 0.00021 1/3/2005 -0.02934 -0.01657 -0.0132 0.00663 2/1/2005 -0.0025 -0.03946 0.00588 0.23294 3/1/2005 -0.00167 -0.03937 -0.04547 -0.05861 4/1/2005 0.0268 0.04677 0.02145 -0.04303 5/2/2005 0.01855 0.02298 0.02836 -0.00957 6/1/2005 -0.04343 -0.03744 -0.00583 0.0226 7/1/2005 0.05985 0.03111 -0.04401 0.02229 8/1/2005 -0.00257 0.07209 -0.0014 0.02458 9/1/2005 0.07165 -0.0602 -0.02179 0.06061 10/3/2005 -0.05356 -0.00125 0.03913 -0.11633 11/1/2005 0.02147 0.08038 0.06047 0.03888 12/1/2005 0.01204 -0.05513 0.0057 -0.03205 1/3/2006 0.02832 0.0763 -0.04175 0.11713 2/1/2006 0.01175 -0.04208 0.03685 -0.04883 3/1/2006 -0.03847 0.01266 0.00415 0.02504 4/3/2006 0.01585 -0.11254 0.0961 0.03655 5/1/2006 -0.06818 -0.05856 -0.0205 -0.0295 6/1/2006 0.02492 0.02853 -0.00602 0.00716 7/3/2006 0.01653 0.03274 0.07117 0.10423 8/1/2006 0.10142 0.07221 0.00972 0.00346 9/1/2006 0.00122 0.06407 0.04073 -0.0083 10/2/2006 0.02794 0.04979 0.00559 0.06439 11/1/2006 -0.00945 0.0261 0.01005 0.08007 12/1/2006 0.02352 0.0172 -0.00847 -0.00233 1/3/2007 0.0333 0.04192 0.00384 -0.04046 For this assignment, please use excel file group_assignment_1_portfolios.xls posted on blackboard under the folder of Excel Files. The file contains the monthly returns of 4 stocks over the 10 year period -- January 1997 -- December 2006. In this file, the expected monthly return for each stock is calculated using excel function AVERAGE (), for each stock, the variance of monthly returns is calculated using Excel function VAR (), and the covariance between the returns of each pair of stocks is calculated using Excel function COVAR (). Assume that the yearly risk free rate is 2% (A monthly risk free rate of 0.001652). (a) Plot the minimum variance frontier for an investor who wants to allocate his money to PG, BAC, and the risk-free asset. Find the optimal risky portfolio. What are the mean and s.d. of the returns of this portfolio? For questions (b), (c), and (d), we assume that investors invest in the risk-free asset and 4 risky assets (PG, Microsoft, BAC, and Exxon). (b) Find the optimal investment portfolio in the risky assets. What are the mean and s.d. of the returns of this portfolio? (c) Find the global minimum variance portfolio. What is the expected return and variance of return of this portfolio? (d) What would be the capital allocation between the risk free asset and the optimal risky investment portfolio for an individual with risk aversion coefficient of 3? If the initial investment is $100,000, how much money should the investor allocate to each of the 5 assets (risk free asset and 4 risky assets). F G H J Expected Monthly Return Expected Monthly Return PG 0.010848) Microsoft 0.014854 BAC 0.011589 Exxon 0.012043 000 PG Microsoft BAC Exxon Variance Variance 0.004478 0.012820 0.005611 0.002820 A B D E 1 Date PG Microsoft BAC Exxon 2 2/3/1997 0.039059 -0.04394 0.109771 -0.02517 3 3/3/1997 -0.04485 -0.05994 -0.07011 0.074816 4 4/1/1997 0.099732 0.325186 0.088252 0.051471 5 5/1/1997 0.096787 0.02085 -0.0247 0.053613 6 6/2/1997 0.024472 0.018853 0.102423 0.033628 7 7/1/1997 0.080347 0.118736 0.102398 0.048801 8 8/1/1997 -0.12496 -0.06478 -0.1604 -0.04122 9 9/2/1997 0.037519 0.000737 0.041554 0.046828 10 10/1/1997 -0.01181 -0.01767 -0.03368 -0.04067 11 11/3/1997 0.120612 0.088456 0.00429 -0.00042 12 12/1/1997 0.047318 -0.08678 0.018687 0.002969 13 1/2/1998 -0.01495 0.1546 -0.0152 -0.03087 14 2/2/1998 0.08301 0.135859 0.143693 0.082024 15 3/2/1998 -0.00596 0.056354 0.070731 0.060887 16 4/1/1998 -0.0228 0.007077 0.042156 0.080578 17 5/1/1998 0.020264 -0.05892 -0.00667 -0.02955 18 6/1/1998 0.085766 0.277427 0.020991 0.012323 19 7/1/1998 -0.12555 0.014388 0.039885 -0.01575 20 8/3/1998 -0.03613 -0.12722 -0.27916 -0.06293 21 9/1/1998 -0.07037 0.147283 -0.06308 0.079193 22 10/1/1998 0.251503 -0.03807 0.074941 0.014029 23 11/2/1998 -0.01215 0.152324 0.133442 0.05321 24 12/1/1998 0.042346 0.136981 -0.07112 -0.02492 25 1/4/1999 -0.00165 0.261679 0.111743 -0.03938 26 2/1/1999 -0.01512 -0.14226 -0.02327 -0.04711 27 3/1/1999 0.094361 0.194093 0.088614 0.06 28 4/1/1999 -0.03929 -0.09269 0.013567 0.177287 29 5/3/1999 -0.00478 -0.00779 -0.09629 -0.03357 30 6/1/1999 -0.0563 0.117754 0.141424 -0.03442 31 7/1/1999 0.031383 -0.04862 -0.0946 0.029164 32 8/2/1999 0.095943 0.078932 -0.0883 -0.00126 33 9/1/1999 -0.05528 -0.02184 -0.07252 -0.03657 34 10/1/1999 0.122319 0.02233 0.156916 -0.02552 35 11/1/1999 0.029724 -0.01632 -0.09074 0.077569 36 12/1/1999 0.014433 0.282236 -0.13617 0.015581 37 1/3/2000 -0.07498 -0.16169 -0.0349 0.028843 2/1/2000 -0.13062 -0.08686 -0.0505 -0.08619 Covariance Cov(PG, Microsoft) Cov(PG, BAC) Cov(PG, Exxon) Cov(Microsoft, BAC) Cov(Microsoft, Exxon) Cov(BAC, Exxon) -0.000649 0.000683 0.000433 0.001681 0.000804 0.000757 38 39 40 41 42 43 44 45 46 47 48 49 50 51 52 53 54 55 56 57 58 59 60 61 62 63 64 65 66 67 68 69 70 71 72 73 74 75 76 77 78 79 80 81 82 83 84 85 86 A B C D E 3/1/2000 -0.35411 0.18888 0.15299 0.03557 4/3/2000 0.05783 -0.34365 -0.06549 -0.00378 5/1/2000 0.11303 -0.10304 0.14138 0.07814 6/1/2000 -0.1466 0.27882 -0.22424 -0.05781 7/3/2000 0.01039 -0.12728 0.10186 0.02149 8/1/2000 0.0848 0 0.14179 0.02378 9/1/2000 0.0837 -0.13608 -0.02243 0.09142 10/2/2000 0.07104 0.14176 -0.08226 0.00082 11/1/2000 0.0483 -0.16696 0.15732 -0.00845 12/1/2000 0.0477 -0.24374 0.14906 -0.0121 1/2/2001 -0.0799 0.40707 0.17254 -0.03201 2/1/2001 -0.01851 -0.03352 -0.04726 -0.03191 3/1/2001 -0.11214 -0.07308 0.07948 -0.00059 4/2/2001 -0.03476 0.23875 0.02298 0.09391 5/1/2001 0.06963 0.02122 0.06789 0.00652 6/1/2001 -0.00673 0.05528 0.01338 -0.01538 7/2/2001 0.1194 -0.09343 0.05991 -0.04386 8/1/2001 0.04408 -0.13802 -0.03338 -0.03326 9/4/2001 -0.01837 -0.1029 -0.0419 -0.01868 10/1/2001 0.01904 0.13613 0.01009 0.00121 11/1/2001 0.04994 0.10432 0.04044 -0.04648 12/3/2001 0.02148 0.03187 0.03567 0.05097 1/2/2002 0.03725 -0.0386 0.00132 -0.00633 2/1/2002 0.03794 -0.08413 0.02425 0.06396 3/1/2002 0.0625 0.03382 0.06371 0.06125 4/1/2002 0.00604 -0.13368 0.06556 -0.08349 5/1/2002 -0.00783 -0.02564 0.04596 -0.00029 6/3/2002 0.005 0.07416 -0.06427 0.02461 7/1/2002 0.00157 -0.12249 -0.0551 -0.10152 8/1/2002 -0.00392 0.02284 0.0538 -0.0296 9/3/2002 0.0084 -0.10868 -0.08106 -0.10003 10/1/2002 -0.00598 0.22216 0.09372 0.05503 11/1/2002 -0.04424 0.07882 0.00427 0.04076 12/2/2002 0.01671 -0.10389 0.00193 0.00398 1/2/2003 0.00027 -0.082 0.00694 -0.02248 2/3/2003 -0.04336 0.00205 -0.01186 0.00304 3/3/2003 0.08784 0.02152 -0.02517 0.02731 4/1/2003 0.01372 0.05617 0.10767 0.00722 5/1/2003 0.02196 -0.03751 0.00215 0.04138 6/2/2003 -0.02873 0.04193 0.07409 -0.01345 7/1/2003 -0.00977 0.02983 0.04465 -0.0092 8/1/2003 -0.00649 0.00414 -0.04019 0.0669 9/2/2003 0.06327 0.04853 -0.00532 -0.0294 10/1/2003 0.06418 -0.05459 -0.0294 -0.00031 11/3/2003 -0.02103 -0.01663 -0.00413 -0.0034 12/1/2003 0.038 0.06482 0.07777 0.13249 1/2/2004 0.0166 0.01015 0.01283 -0.00521 2/2/2004 0.01409 -0.04061 0.00538 0.04021 87 88 89 90 91 92 93 94 95 96 97 98 99 100 101 102 103 104 105 106 107 108 109 110 111 112 113 114 115 116 117 118 119 120 121 A B D E 3/1/2004 0.02316 -0.06008 -0.00157 -0.01377 4/1/2004 0.01358 0.04794 -0.00599 0.02309 5/3/2004 0.01914 0.00416 0.03269 0.02309 6/1/2004 0.00981 0.08836 0.02766 0.02693 7/1/2004 -0.03761 -0.00211 0.00478 0.04246 8/2/2004 0.07322 -0.03898 0.05833 0.00168 9/1/2004 -0.03301 0.01279 -0.027 0.04831 10/1/2004 -0.04987 0.01132 0.03353 0.01848 11/1/2004 0.04486 0.06845 0.033 0.04682 12/1/2004 0.03001 -0.00322 0.02572 0.00021 1/3/2005 -0.02934 -0.01657 -0.0132 0.00663 2/1/2005 -0.0025 -0.03946 0.00588 0.23294 3/1/2005 -0.00167 -0.03937 -0.04547 -0.05861 4/1/2005 0.0268 0.04677 0.02145 -0.04303 5/2/2005 0.01855 0.02298 0.02836 -0.00957 6/1/2005 -0.04343 -0.03744 -0.00583 0.0226 7/1/2005 0.05985 0.03111 -0.04401 0.02229 8/1/2005 -0.00257 0.07209 -0.0014 0.02458 9/1/2005 0.07165 -0.0602 -0.02179 0.06061 10/3/2005 -0.05356 -0.00125 0.03913 -0.11633 11/1/2005 0.02147 0.08038 0.06047 0.03888 12/1/2005 0.01204 -0.05513 0.0057 -0.03205 1/3/2006 0.02832 0.0763 -0.04175 0.11713 2/1/2006 0.01175 -0.04208 0.03685 -0.04883 3/1/2006 -0.03847 0.01266 0.00415 0.02504 4/3/2006 0.01585 -0.11254 0.0961 0.03655 5/1/2006 -0.06818 -0.05856 -0.0205 -0.0295 6/1/2006 0.02492 0.02853 -0.00602 0.00716 7/3/2006 0.01653 0.03274 0.07117 0.10423 8/1/2006 0.10142 0.07221 0.00972 0.00346 9/1/2006 0.00122 0.06407 0.04073 -0.0083 10/2/2006 0.02794 0.04979 0.00559 0.06439 11/1/2006 -0.00945 0.0261 0.01005 0.08007 12/1/2006 0.02352 0.0172 -0.00847 -0.00233 1/3/2007 0.0333 0.04192 0.00384 -0.04046 For this assignment, please use excel file group_assignment_1_portfolios.xls posted on blackboard under the folder of Excel Files. The file contains the monthly returns of 4 stocks over the 10 year period -- January 1997 -- December 2006. In this file, the expected monthly return for each stock is calculated using excel function AVERAGE (), for each stock, the variance of monthly returns is calculated using Excel function VAR (), and the covariance between the returns of each pair of stocks is calculated using Excel function COVAR (). Assume that the yearly risk free rate is 2% (A monthly risk free rate of 0.001652). (a) Plot the minimum variance frontier for an investor who wants to allocate his money to PG, BAC, and the risk-free asset. Find the optimal risky portfolio. What are the mean and s.d. of the returns of this portfolio? For questions (b), (c), and (d), we assume that investors invest in the risk-free asset and 4 risky assets (PG, Microsoft, BAC, and Exxon). (b) Find the optimal investment portfolio in the risky assets. What are the mean and s.d. of the returns of this portfolio? (c) Find the global minimum variance portfolio. What is the expected return and variance of return of this portfolio? (d) What would be the capital allocation between the risk free asset and the optimal risky investment portfolio for an individual with risk aversion coefficient of 3? If the initial investment is $100,000, how much money should the investor allocate to each of the 5 assets (risk free asset and 4 risky assets)
Get Answers to Unlimited Questions
Join us to gain access to millions of questions and expert answers. Enjoy exclusive benefits tailored just for you!
Membership Benefits:
- Unlimited Question Access with detailed Answers
- Zin AI - 3 Million Words
- 10 Dall-E 3 Images
- 20 Plot Generations
- Conversation with Dialogue Memory
- No Ads, Ever!
- Access to Our Best AI Platform: Zin AI - Your personal assistant for all your inquiries!
Other questions asked by students
Statistics
Operations Management
Medical Sciences
Accounting
StudyZin's Question Purchase
1 Answer
$0.99
(Save $1 )
One time Pay
- No Ads
- Answer to 1 Question
- Get free Zin AI - 50 Thousand Words per Month
Best
Unlimited
$4.99*
(Save $5 )
Billed Monthly
- No Ads
- Answers to Unlimited Questions
- Get free Zin AI - 3 Million Words per Month
*First month only
Free
$0
- Get this answer for free!
- Sign up now to unlock the answer instantly
You can see the logs in the Dashboard.