PLEASE ANSWER FULL THE QUESTION. THANK YOU!! Comparative financial statements for The Pharoah...
90.2K
Verified Solution
Link Copied!
Question
Accounting
PLEASE ANSWER FULL THE QUESTION. THANK YOU!!
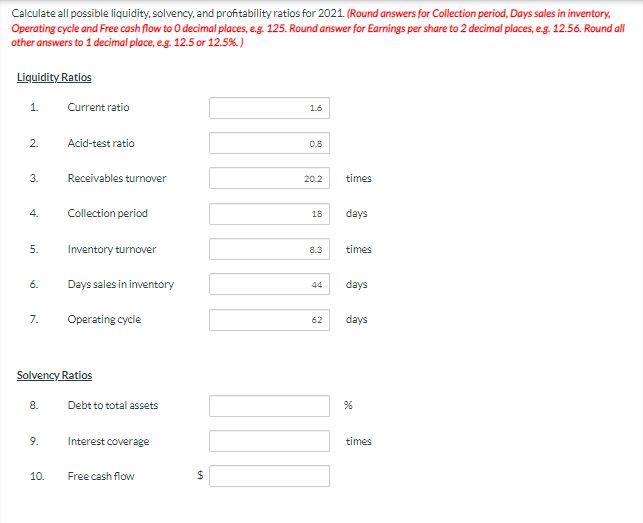
Comparative financial statements for The Pharoah Company Ltd. are shown below. THE PHAROAH COMPANY LTD. Income Statement Year Ended December 31 2021 2020 Net sales $2,077,200 $1,853,210 1,065,580 1.013,530 Cost of goods sold Gross profit Operating expenses 1,011,620 839.680 550,500 482,010 Profit from operations 461,120 357,670 27.540 17,180 Interest expense Proht before income tax 433,580 340,490 Income tax expense 130,074 102,147 Profit $303,506 $238,343 THE PHAROAH COMPANY LTD. Balance Sheet December 31 Assets 2021 2020 Current assets Cash $39,504 $64.926 107,589 97.677 149,630 107,830 296,723 270.433 716,827 558,456 $1,013,550 $828.889 $141,120 $116,805 Accounts receivable Inventory Total current assets Property, plant, and equipment Total assets Liabilities and Shareholders' Equity Current liabilities Accounts payable Income tax payable Current portion of mortgage payable Total current liabilities Mortgage payable Total liabilities Shareholders' equity Common shares (61.930 issued in 2021: 65.550 in 2020) Retained earnings Total shareholders' equity 39,540 46,030 10,600 18.730 191,260 181.565 104,770 195,300 296,030 376.865 185,790 196.650 531,730 255,374 717,520 452,024 185,790 196.650 531,730 255,374 Common shares (61.930 issued in 2021: 65,550 in 2020) Retained earnings Total shareholders' equity Total liabilities and shareholders' equity 717,520 452.024 $1,013,550 $828,889 Additional information: 1. 2. 3. All sales were on account. The allowance for doubtful accounts was $5,868 in 2021 and $5.256 in 2020. On July 1, 2021, 3.620 shares were reacquired for $9 per share and cancelled. In 2021. $5,430 of dividends were paid to the common shareholders. Cash provided by operating activities was $310,320. Cash used by investing activities was $176,303. 4. 5. 6. Calculate all possible liquidity, solvency, and profitability ratios for 2021. (Round answers for Collection period, Days sales in inventory. Operating cycle and Free cash flow to O decimal places, eg 125. Round answer for Earnings per share to 2 decimal places, eg. 12.56. Round all other answers to 1 decimal place. eg. 12.5 or 12.5%) Liquidity Ratios 1. Current ratio 1.6 L6 2. Acid-test ratio 0.8 3. Receivables turnover 20-2 times 4 Collection period 18 days Calculate all possible liquidity, solvency, and profitability ratios for 2021. (Round answers for Collection period, Days sales in inventory, Operating cycle and Free cash flow to O decimal places, eg. 125. Round answer for Earnings per share to 2 decimal places, eg. 12.56. Round all other answers to 1 decimal place, eg. 12.5 or 12.5%) Liquidity Ratlos 1. Current ratio 1.6 2. Acid-test ratio 0.8 3. Receivables turnover 20.2 times 4. Collection period 18 days 5. Inventory turnover 8.3 times 6. Days sales in inventory 44 days 7. Operating cycle 62 days Solvency Ratios 8. Debt to total assets 96 9. Interest coverage times 10. Free cash flow $ $ Profitability Ratios 11. Gross profit margin %6 12. Profit margin 96 13. Asset turnover times 14. Return on assets 96 15. Return on equity 96 16. Earnings per share $ 17. Payout ratio 96
Answer & Explanation
Solved by verified expert
Get Answers to Unlimited Questions
Join us to gain access to millions of questions and expert answers. Enjoy exclusive benefits tailored just for you!
Membership Benefits:
Unlimited Question Access with detailed Answers
Zin AI - 3 Million Words
10 Dall-E 3 Images
20 Plot Generations
Conversation with Dialogue Memory
No Ads, Ever!
Access to Our Best AI Platform: Zin AI - Your personal assistant for all your inquiries!