Peter analyzed a set of data with explanatory and response variables x and y He...
70.2K
Verified Solution
Link Copied!
Question
Statistics
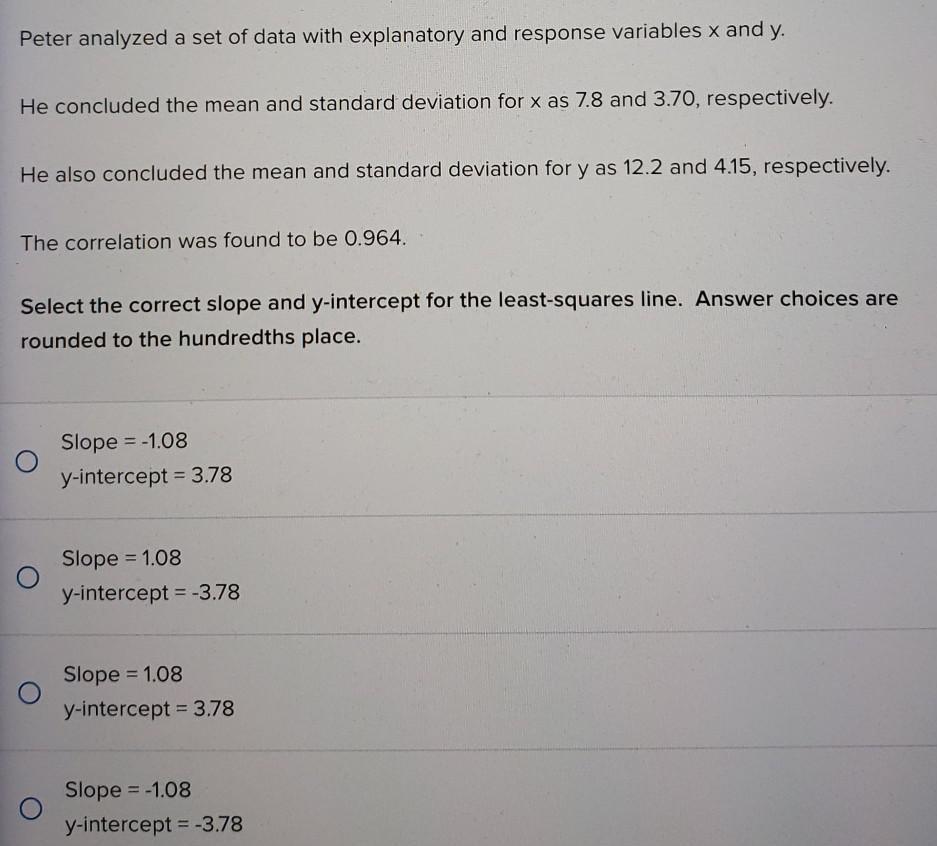
Peter analyzed a set of data with explanatory and response variables x and y He concluded the mean and standard deviation for x as 7 8 and 3 70 respectively He also concluded the mean and standard deviation for y as 12 2 and 4 15 respectively The correlation was found to be 0 964 Select the correct slope and y intercept for the least squares line Answer choices are rounded to the hundredths place O O O O Slope 1 08 y intercept 3 78 Slope 1 08 y intercept 3 78 Slope 1 08 y intercept 3 78 Slope 1 08 y intercept 3 78
Answer & Explanation
Solved by verified expert
Get Answers to Unlimited Questions
Join us to gain access to millions of questions and expert answers. Enjoy exclusive benefits tailored just for you!
Membership Benefits:
Unlimited Question Access with detailed Answers
Zin AI - 3 Million Words
10 Dall-E 3 Images
20 Plot Generations
Conversation with Dialogue Memory
No Ads, Ever!
Access to Our Best AI Platform: Zin AI - Your personal assistant for all your inquiries!