Open exploring e05_grader h2 RealEstate.xisx and save it as exploring e05 grader_h2_RealEstate LastFirst. 2 In...
50.1K
Verified Solution
Question
Accounting
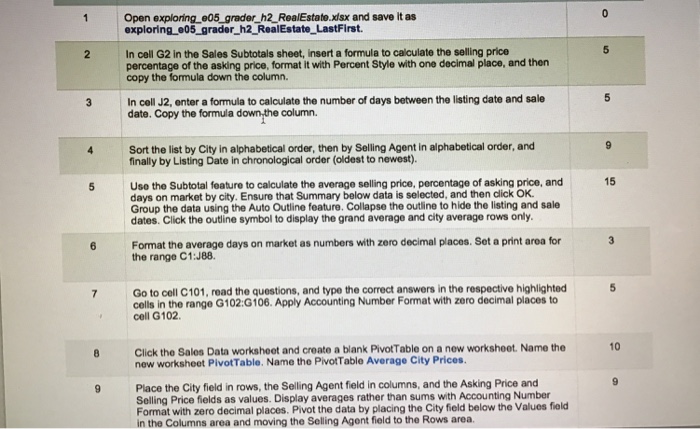 Open exploring e05_grader h2 RealEstate.xisx and save it as exploring e05 grader_h2_RealEstate LastFirst. 2 In cell G2 in the Sales Subtotals sheet, insert a formula to calculate the selling price percentage of the asking price, format it with Percent Style with one decimal place, and then copy the formula down the column. 3 In cell J2, enter a formula to calculate the number of days between the listing date and sale date. Copy the formula down,the column. Sort the list by City in alphabetical order, then by Selling Agent in alphabetical order, and finally by Listing Date in chronological order (oldest to newest). Use the Subtotal feature to calculate the average selling price, percentage of asking price, and days on market by city. Ensure that Summary below data is selected, and then click OK. Group the data using the Auto Outline feature. Collapse the outline to hide the listing and sale dates. Click the outline symbol to display the grand average and city average rows only 15 5 Format the average days on market as numbers with zero decimal places. Set a print aroa for the range C1:J88. 7 Go to cell C101, read the questions, and type the correct answers in the respective highlighted cells in the range G102:G106. Apply Accounting Number Format with zero decimal places to cell G102. 10 8 Click the Sales Data worksheet and create a blank PivotTable on a new worksheet. Name the new worksheet PivotTable. Name the PivotTable Average City Prices 9 Place the City field in rows, the Selling Agent field in columns, and the Asking Price and Selling Price fields as values. Display averages rather than sums with Accounting Number Format with zero decimal places. Pivot the data by placing the City field below the Values field in the Columns area and moving the Selling Agent field to the Rows area Open exploring e05_grader h2 RealEstate.xisx and save it as exploring e05 grader_h2_RealEstate LastFirst. 2 In cell G2 in the Sales Subtotals sheet, insert a formula to calculate the selling price percentage of the asking price, format it with Percent Style with one decimal place, and then copy the formula down the column. 3 In cell J2, enter a formula to calculate the number of days between the listing date and sale date. Copy the formula down,the column. Sort the list by City in alphabetical order, then by Selling Agent in alphabetical order, and finally by Listing Date in chronological order (oldest to newest). Use the Subtotal feature to calculate the average selling price, percentage of asking price, and days on market by city. Ensure that Summary below data is selected, and then click OK. Group the data using the Auto Outline feature. Collapse the outline to hide the listing and sale dates. Click the outline symbol to display the grand average and city average rows only 15 5 Format the average days on market as numbers with zero decimal places. Set a print aroa for the range C1:J88. 7 Go to cell C101, read the questions, and type the correct answers in the respective highlighted cells in the range G102:G106. Apply Accounting Number Format with zero decimal places to cell G102. 10 8 Click the Sales Data worksheet and create a blank PivotTable on a new worksheet. Name the new worksheet PivotTable. Name the PivotTable Average City Prices 9 Place the City field in rows, the Selling Agent field in columns, and the Asking Price and Selling Price fields as values. Display averages rather than sums with Accounting Number Format with zero decimal places. Pivot the data by placing the City field below the Values field in the Columns area and moving the Selling Agent field to the Rows area

Get Answers to Unlimited Questions
Join us to gain access to millions of questions and expert answers. Enjoy exclusive benefits tailored just for you!
Membership Benefits:
- Unlimited Question Access with detailed Answers
- Zin AI - 3 Million Words
- 10 Dall-E 3 Images
- 20 Plot Generations
- Conversation with Dialogue Memory
- No Ads, Ever!
- Access to Our Best AI Platform: Flex AI - Your personal assistant for all your inquiries!
Other questions asked by students
StudyZin's Question Purchase
1 Answer
$0.99
(Save $1 )
One time Pay
- No Ads
- Answer to 1 Question
- Get free Zin AI - 50 Thousand Words per Month
Best
Unlimited
$4.99*
(Save $5 )
Billed Monthly
- No Ads
- Answers to Unlimited Questions
- Get free Zin AI - 3 Million Words per Month
*First month only
Free
$0
- Get this answer for free!
- Sign up now to unlock the answer instantly
You can see the logs in the Dashboard.