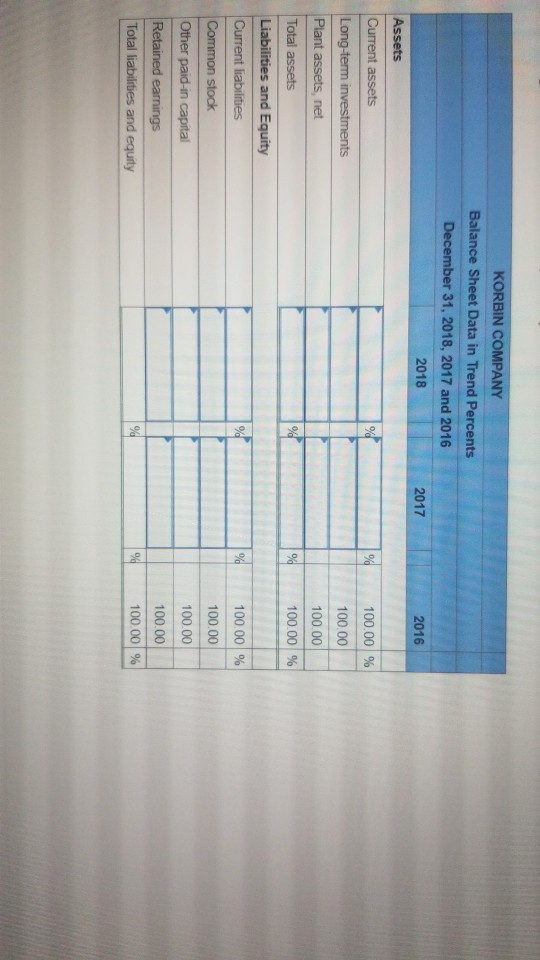
KORBIN COMPANY Comparative Income Statements For Years Ended December 31, 2018, 2017, and 2016 2018 2017 2016 Sales $389,743 $298,575 $207,200 Cost of goods sold 234,625 188,401 132,608 Gross profit 155, 118 110,174 74,592 Selling expenses 55,344 41,203 27, 350 Administrative expenses 35,077 26,275 | 17,198 Total expenses 90,421 67,478 44,548 Income before taxes 64,697 42,696 30,044 Income tax expense 12,034 8,753 6,099 Net income $ 52,663 $ 33,943 $ 23,945 KORBIN COMPANY Comparative Balance Sheets December 31, 2018, 2017, and 2016 2018 2017 2016 Assets Current assets $ 49,298 $ 38,563 $ 51,550 Long-term investments 600 4,850 Plant assets, net 92,961 98,968 58,042 Total assets $142,251 $138, 131 $114,442 Liabilities and Equity Current liabilities $ 20,769 $ 20,582 $ 20,027 Common stock 65,000 65,000 47,000 Other paid in capital 8,125 8,125 5,222 Retained earnings 48,357 44,424 42,193 Total liabilities and equity $142,251 $138,131 $114,442 KORBIN COMPANY Balance Sheet Data in Trend Percents December 31, 2018, 2017 and 2016 2018 2017 2016 Assets 100.00 % 100.00 100.00 100.00 % % Current assets Long-term investments Plant assets, net Total assets Liabilities and Equity Current liabilities Common stock Other paid-in capital Retained earnings Total liabilities and equity 100.00 % 100.00 100.00 100.00 100.00 %
Answer & Explanation
Solved by verified expert
Get Answers to Unlimited Questions
Join us to gain access to millions of questions and expert answers. Enjoy exclusive benefits tailored just for you!
Membership Benefits:
Unlimited Question Access with detailed Answers
Zin AI - 3 Million Words
10 Dall-E 3 Images
20 Plot Generations
Conversation with Dialogue Memory
No Ads, Ever!
Access to Our Best AI Platform: Zin AI - Your personal assistant for all your inquiries!