Kelly Services currently has 0% debt, but is considering acquiring either 30%, 50%, or 70%...
80.2K
Verified Solution
Link Copied!
Question
Finance
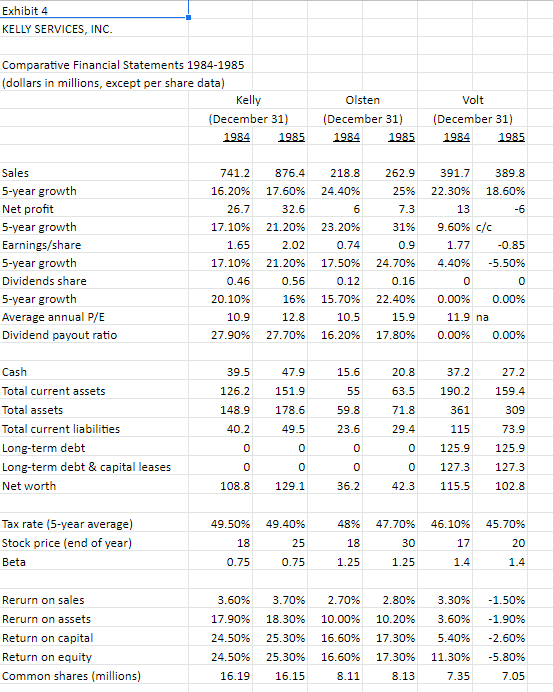
Kelly Services currently has 0% debt, but is considering acquiring either 30%, 50%, or 70% debt. On the basis of return and risk, how does increased leverage affect a company and the individual shareholder?
Exhibit 5 KELLY SERVICES, INC. Proportion of Debt to Equity for 1986 Actual Net Income (millions) Earnings/shre Dividends/share Proportion of Debt to Equity 30 Percent 50 Percent 70 Percent $32.60 $29.60 $27.90 $26.30 2.01 2.03 2.06 2.1 0.56 0.57 0.58 0.59 Interest rate on long-term debt Tax rate Payout Ratio 12.50% 50.00% 28.00% Exhibit 5 KELLY SERVICES, INC Pro Forma 1986 Results for Alternative Capital Structures (dollars in millions, except per share data) Sales Earnings before intetest & taxes Interest Actual 876.4 64 Pro Forma Percent Debt 30.00% 50.00% 70.00% 876.4 876.4 876.4 64 64 64 4.8 8.1 11.3 0 59.2 Earnings before taxes Taxes 64 31.4 55.9 28 52.7 26.4 29.6 Net earnings Dividends 32.6 8.9 29.6 8.3 27.9 7.8 26.3 7.4 Shares outstanding (millions) Earnings/share Price/earnings Dividends/share Dividend yield 16.15 2.02 12.38 14.6 2.03 N.Av. 13.57 2.06 12.53 2.1 N.Av. N.Av. 0.55 0.57 0.58 0.59 2.20% N.Av. N.Av. N.Av. 0 Beginning of year Debt Net worth Stock price/share 38.7 90.4 64.6 64.6 90.4 38.7 129.1 25 N.Av. N.Av. N.Av. Exhibit 4 KELLY SERVICES, INC. Comparative Financial Statements 1984-1985 (dollars in millions, except per share data) Kelly (December 31) 1984 1985 Olsten (December 31) 1984 1985 Volt (December 31) 1984 1985 Sales 5-year growth Net profit 5-year growth Earnings/share 5-year growth Dividends share 5-year growth Average annual P/E Dividend payout ratio 741.2 16.20% 26.7 17.10% 1.65 17.10% 0.46 20.10% 10.9 27.90% 876.4 17.60% 32.6 21.20% 2.02 21.20% 218.8 24.40% 6 23.20% 0.74 17.50% 0.12 262.9 25% 7.3 31% 0.9 24.70% 0.16 22.40% 15.9 17.80% 391.7 389.8 22.30% 18.60% 13 -6 9.60% c/C 1.77 -0.85 4.40% -5.50% 0 0 0.00% 0.00% 11.9 na 0.00% 0.00% 0.56 16% 15.70% 12.8 27.70% 10.5 16.20% 47.9 15.6 20.8 37.2 27.2 39.5 126.2 148.9 55 63.5 151.9 178.6 190.2 361 159.4 309 59.8 71.8 Cash Total current assets Total assets Total current liabilities Long-term debt Long-term debt & capital leases Net worth 40.2 49.5 23.6 29.4 115 73.9 125.9 0 0 125.9 0 o 0 0 0 0 127.3 127.3 108.8 129.1 36.2 42.3 115.5 102.8 Tax rate (5-year average) Stock price (end of year) Beta 49.50% 18 0.75 49.40% 25 48% 18 47.70% 30 1.25 46.10% 17 45.70% 20 1.4 0.75 1.25 1.4 3.70% Rerurn on sales Rerurn on assets Return on capital Return on equity Common shares (millions) -1.50% -1.90% 3.60% 17.90% 24.50% 24.50% 16.19 2.70% 10.00% 16.60% 18.30% 25.30% 2.80% 10.20% 17.30% 17.30% 3.30% 3.60% 5.40% 11.30% 7.35 -2.60% -5.80% 25.30% 16.60% 16.15 8.11 8.13 7.05 Exhibit 3 KELLY SERVICES, INC. Quarterly Stock Price Data Class A High Class B High 500 Low Low 102.9 1980 1 2 3 114.2 125.5 135.8 136 4 1981 1 2 131.2 w N Common High Low 8.625 5.125 7.25 6.25 9.875 7.25 9.375 8.75 11.25 8.875 13.75 11.125 13.75 11.5 13.5 11.625 12.5 10.875 12.875 9.5 10.625 7.875 13.125 9.875 15 12.125 3 4 1982 1 2 3 4 116.2 122.6 111.9 109.6 122.4 139.4 1519 1983 1 N 166.4 16.25 3 167.2 164.4 17.5 20 4 14 16.125 16 17.75 17.25 1984 1 159.2 20 2 168.1 18 3 166.1 20.5 16.5 20.125 15.5 4 165 21.25 16 20.5 13.25 1985 1 153.2 18 23 23.25 28 18.25 23.125 2 166.1 22 3 25.5 167.2 180.7 26.125 30.125 29.375 26.5 29.375 29 4 24.875 25 Exhibit 2 KELLY SERVICES, INC. Financial Data (dollars in millions, except per share data) 1976 152.4 5.7 1978 279 1977 202.6 7.3 0.45 1979 369.3 15 1980 409.7 15.2 1981 462.6 18.2 1.1 1982 419.9 12 1983 524.4 17.5 1.08 1984 741.2 26.7 1.65 1985 876.4 32.6 2.02 12.6 0.77 0.35 0.91 0.92 0.72 Sales Net income Earnings/share Dividends/share Common Class A common Class B common 0.09 0.1 0.19 0.26 0.3 0.38 N.Ap. N.Ap. N.Ap. N.Ap. 0.14 N.Ap. N.Ap. N.Ap. N.Ap. N.Ap. N.Ap. N.Ap. N.Ap. 0.36 N.Ap. N.Ap. N.Ap. N.Ap. N.Ap. 0.46 0.37 N.Ap. 0.55 0.45 75.1 9.8 0 37 0 22 27.4 44.5 0 20.1 32.8 60.3 0 27.5 42.8 148.9 39.5 86 38 54.7 6.1 3.50% 108.8 47.7 67 84.2 15.1 3.30% 124.2 35.7 71.5 89.4 15 5.5 87.9 22.5 48.3 65.7 8.6 3.40% 3.70% 17.30% 23.10% 178.6 48.1 102.4 129.1 12.4 6.9 104.2 37.9 60.9 78.4 10.6 2.50% 3.90% 17.50% 23.20% 6.8 3.20% 4.50% 3.50% Assets Cash Net working capital Stockholders' equity Average P/E ratio Average dividend yield Return on sales Return on assets Return on equity Shares outstanding (000): Common Class A Class B 2.40% 2.20% 108.8 10.9 2.50% 3.60% 17.90% 24.50% 3.70% 3.60% 4.50% 4.10% 2.80% 3.30% 15.40% 20.90% 11.00% 14.10% 16.40% 22.30% 20.00% 27.40% 3.70% 18.30% 25.30% 20.80% 29.40% 14.20% 19.60% 16266 16303 16365 16489 16563 16553 16539 16174 16192 13875 2317 16147 13946 2201 Beta 0.75 0.75 Exhibit 1 KELLY SERVICES, INC. 11 Interest Rates on Debt of Different Quality U.S. Treasury Bonds Corporate Bonds Year Month Prime 3 Years 10 Years Aaa Aa A Baa 1980 15.27 11.55 11.46 11.94 12.5 12.89 13.67 1981 18.87 14.44 13.91 14.17 14.75 15.29 16.04 1982 14.86 12.92 13 13.79 14.41 15.43 16.11 1983 10.79 10.45 11.1 12.04 12.42 13.1 13.55 1984 12.04 11.89 12.44 12.71 13.31 13.74 14.19 1985 1 10.61 10.43 11.38 11.37 11.82 12.28 12.72 2 10.5 10.55 11.51 12.13 12.49 12.8 13.23 3 10.5 11.05 11.85 12.56 12.91 13.36 13.69 4 10.5 10.49 11.43 12.23 12.69 13.14 13.51 5 10.31 9.75 10.85 11.72 12.3 12.7 13.15 6 9.78 9.05 10.16 10.94 11.46 11.98 12.4 7 9.5 9.18 10.31 10.97 11.42 11.92 12.43 8 9.5 9.31 10.33 11.05 11.47 12 12.5 9 9.5 9.37 10.37 11.07 11.46 11.99 12.48 10 9.5 9.25 10.24 11.02 11.45 11.94 12.36 11 9.5 8.88 9.78 10.55 11.07 11.54 11.99 12 9.5 8.4 9.25 10.16 10.63 11.19 11.58 w N 00 Exhibit 5 KELLY SERVICES, INC. Proportion of Debt to Equity for 1986 Actual Net Income (millions) Earnings/shre Dividends/share Proportion of Debt to Equity 30 Percent 50 Percent 70 Percent $32.60 $29.60 $27.90 $26.30 2.01 2.03 2.06 2.1 0.56 0.57 0.58 0.59 Interest rate on long-term debt Tax rate Payout Ratio 12.50% 50.00% 28.00% Exhibit 5 KELLY SERVICES, INC Pro Forma 1986 Results for Alternative Capital Structures (dollars in millions, except per share data) Sales Earnings before intetest & taxes Interest Actual 876.4 64 Pro Forma Percent Debt 30.00% 50.00% 70.00% 876.4 876.4 876.4 64 64 64 4.8 8.1 11.3 0 59.2 Earnings before taxes Taxes 64 31.4 55.9 28 52.7 26.4 29.6 Net earnings Dividends 32.6 8.9 29.6 8.3 27.9 7.8 26.3 7.4 Shares outstanding (millions) Earnings/share Price/earnings Dividends/share Dividend yield 16.15 2.02 12.38 14.6 2.03 N.Av. 13.57 2.06 12.53 2.1 N.Av. N.Av. 0.55 0.57 0.58 0.59 2.20% N.Av. N.Av. N.Av. 0 Beginning of year Debt Net worth Stock price/share 38.7 90.4 64.6 64.6 90.4 38.7 129.1 25 N.Av. N.Av. N.Av. Exhibit 4 KELLY SERVICES, INC. Comparative Financial Statements 1984-1985 (dollars in millions, except per share data) Kelly (December 31) 1984 1985 Olsten (December 31) 1984 1985 Volt (December 31) 1984 1985 Sales 5-year growth Net profit 5-year growth Earnings/share 5-year growth Dividends share 5-year growth Average annual P/E Dividend payout ratio 741.2 16.20% 26.7 17.10% 1.65 17.10% 0.46 20.10% 10.9 27.90% 876.4 17.60% 32.6 21.20% 2.02 21.20% 218.8 24.40% 6 23.20% 0.74 17.50% 0.12 262.9 25% 7.3 31% 0.9 24.70% 0.16 22.40% 15.9 17.80% 391.7 389.8 22.30% 18.60% 13 -6 9.60% c/C 1.77 -0.85 4.40% -5.50% 0 0 0.00% 0.00% 11.9 na 0.00% 0.00% 0.56 16% 15.70% 12.8 27.70% 10.5 16.20% 47.9 15.6 20.8 37.2 27.2 39.5 126.2 148.9 55 63.5 151.9 178.6 190.2 361 159.4 309 59.8 71.8 Cash Total current assets Total assets Total current liabilities Long-term debt Long-term debt & capital leases Net worth 40.2 49.5 23.6 29.4 115 73.9 125.9 0 0 125.9 0 o 0 0 0 0 127.3 127.3 108.8 129.1 36.2 42.3 115.5 102.8 Tax rate (5-year average) Stock price (end of year) Beta 49.50% 18 0.75 49.40% 25 48% 18 47.70% 30 1.25 46.10% 17 45.70% 20 1.4 0.75 1.25 1.4 3.70% Rerurn on sales Rerurn on assets Return on capital Return on equity Common shares (millions) -1.50% -1.90% 3.60% 17.90% 24.50% 24.50% 16.19 2.70% 10.00% 16.60% 18.30% 25.30% 2.80% 10.20% 17.30% 17.30% 3.30% 3.60% 5.40% 11.30% 7.35 -2.60% -5.80% 25.30% 16.60% 16.15 8.11 8.13 7.05 Exhibit 3 KELLY SERVICES, INC. Quarterly Stock Price Data Class A High Class B High 500 Low Low 102.9 1980 1 2 3 114.2 125.5 135.8 136 4 1981 1 2 131.2 w N Common High Low 8.625 5.125 7.25 6.25 9.875 7.25 9.375 8.75 11.25 8.875 13.75 11.125 13.75 11.5 13.5 11.625 12.5 10.875 12.875 9.5 10.625 7.875 13.125 9.875 15 12.125 3 4 1982 1 2 3 4 116.2 122.6 111.9 109.6 122.4 139.4 1519 1983 1 N 166.4 16.25 3 167.2 164.4 17.5 20 4 14 16.125 16 17.75 17.25 1984 1 159.2 20 2 168.1 18 3 166.1 20.5 16.5 20.125 15.5 4 165 21.25 16 20.5 13.25 1985 1 153.2 18 23 23.25 28 18.25 23.125 2 166.1 22 3 25.5 167.2 180.7 26.125 30.125 29.375 26.5 29.375 29 4 24.875 25 Exhibit 2 KELLY SERVICES, INC. Financial Data (dollars in millions, except per share data) 1976 152.4 5.7 1978 279 1977 202.6 7.3 0.45 1979 369.3 15 1980 409.7 15.2 1981 462.6 18.2 1.1 1982 419.9 12 1983 524.4 17.5 1.08 1984 741.2 26.7 1.65 1985 876.4 32.6 2.02 12.6 0.77 0.35 0.91 0.92 0.72 Sales Net income Earnings/share Dividends/share Common Class A common Class B common 0.09 0.1 0.19 0.26 0.3 0.38 N.Ap. N.Ap. N.Ap. N.Ap. 0.14 N.Ap. N.Ap. N.Ap. N.Ap. N.Ap. N.Ap. N.Ap. N.Ap. 0.36 N.Ap. N.Ap. N.Ap. N.Ap. N.Ap. 0.46 0.37 N.Ap. 0.55 0.45 75.1 9.8 0 37 0 22 27.4 44.5 0 20.1 32.8 60.3 0 27.5 42.8 148.9 39.5 86 38 54.7 6.1 3.50% 108.8 47.7 67 84.2 15.1 3.30% 124.2 35.7 71.5 89.4 15 5.5 87.9 22.5 48.3 65.7 8.6 3.40% 3.70% 17.30% 23.10% 178.6 48.1 102.4 129.1 12.4 6.9 104.2 37.9 60.9 78.4 10.6 2.50% 3.90% 17.50% 23.20% 6.8 3.20% 4.50% 3.50% Assets Cash Net working capital Stockholders' equity Average P/E ratio Average dividend yield Return on sales Return on assets Return on equity Shares outstanding (000): Common Class A Class B 2.40% 2.20% 108.8 10.9 2.50% 3.60% 17.90% 24.50% 3.70% 3.60% 4.50% 4.10% 2.80% 3.30% 15.40% 20.90% 11.00% 14.10% 16.40% 22.30% 20.00% 27.40% 3.70% 18.30% 25.30% 20.80% 29.40% 14.20% 19.60% 16266 16303 16365 16489 16563 16553 16539 16174 16192 13875 2317 16147 13946 2201 Beta 0.75 0.75 Exhibit 1 KELLY SERVICES, INC. 11 Interest Rates on Debt of Different Quality U.S. Treasury Bonds Corporate Bonds Year Month Prime 3 Years 10 Years Aaa Aa A Baa 1980 15.27 11.55 11.46 11.94 12.5 12.89 13.67 1981 18.87 14.44 13.91 14.17 14.75 15.29 16.04 1982 14.86 12.92 13 13.79 14.41 15.43 16.11 1983 10.79 10.45 11.1 12.04 12.42 13.1 13.55 1984 12.04 11.89 12.44 12.71 13.31 13.74 14.19 1985 1 10.61 10.43 11.38 11.37 11.82 12.28 12.72 2 10.5 10.55 11.51 12.13 12.49 12.8 13.23 3 10.5 11.05 11.85 12.56 12.91 13.36 13.69 4 10.5 10.49 11.43 12.23 12.69 13.14 13.51 5 10.31 9.75 10.85 11.72 12.3 12.7 13.15 6 9.78 9.05 10.16 10.94 11.46 11.98 12.4 7 9.5 9.18 10.31 10.97 11.42 11.92 12.43 8 9.5 9.31 10.33 11.05 11.47 12 12.5 9 9.5 9.37 10.37 11.07 11.46 11.99 12.48 10 9.5 9.25 10.24 11.02 11.45 11.94 12.36 11 9.5 8.88 9.78 10.55 11.07 11.54 11.99 12 9.5 8.4 9.25 10.16 10.63 11.19 11.58 w N 00
Answer & Explanation
Solved by verified expert
Get Answers to Unlimited Questions
Join us to gain access to millions of questions and expert answers. Enjoy exclusive benefits tailored just for you!
Membership Benefits:
Unlimited Question Access with detailed Answers
Zin AI - 3 Million Words
10 Dall-E 3 Images
20 Plot Generations
Conversation with Dialogue Memory
No Ads, Ever!
Access to Our Best AI Platform: Zin AI - Your personal assistant for all your inquiries!