Item D ading in the visual display of data below Misleading pie chart Item A...
60.1K
Verified Solution
Link Copied!
Question
Statistics
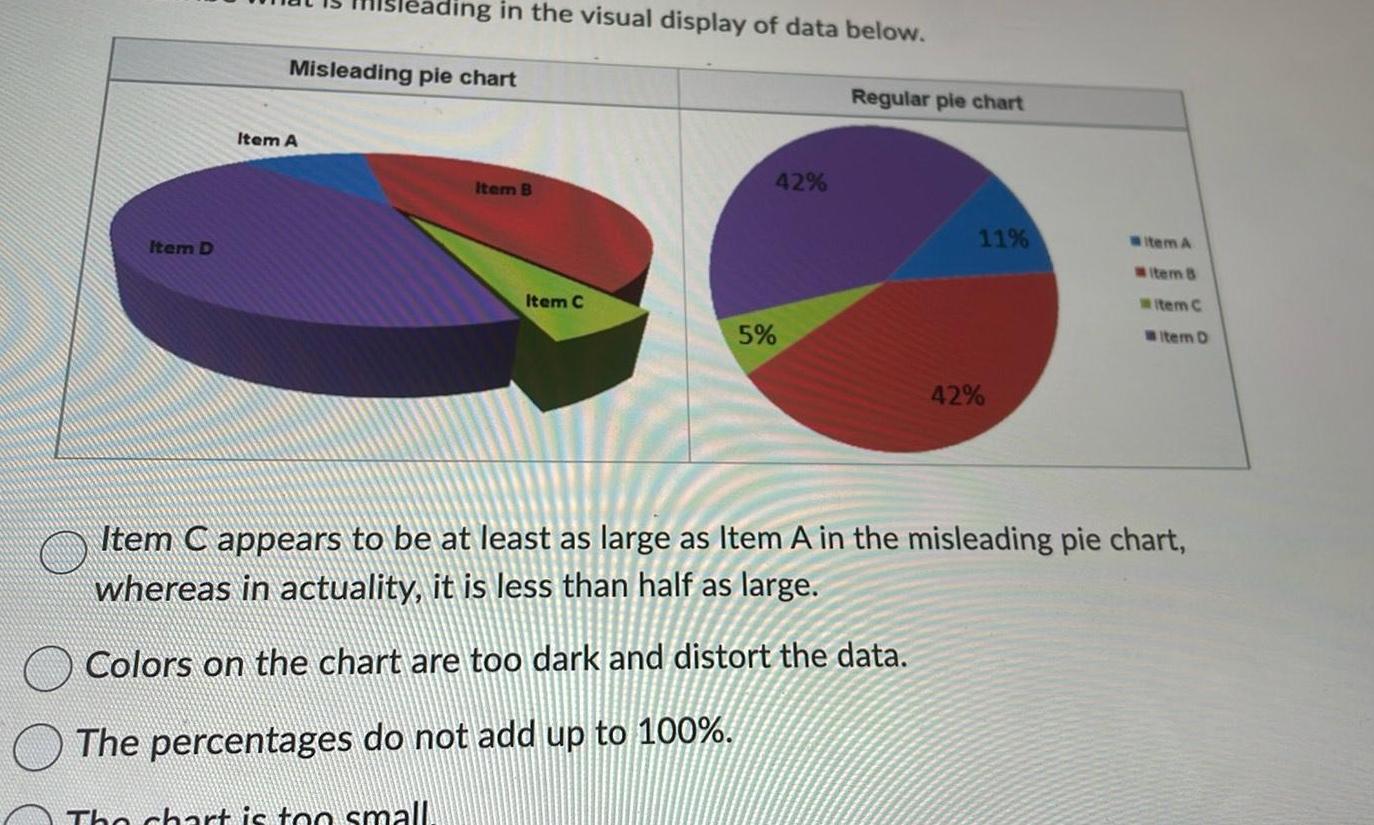
Item D ading in the visual display of data below Misleading pie chart Item A Item B Item C 42 5 Regular pie chart 11 42 item A item 8 item C Item D Item C appears to be at least as large as Item A in the misleading pie chart whereas in actuality it is less than half as large Colors on the chart are too dark and distort the data The percentages do not add up to 100 The chart is too small
Answer & Explanation
Solved by verified expert
Get Answers to Unlimited Questions
Join us to gain access to millions of questions and expert answers. Enjoy exclusive benefits tailored just for you!
Membership Benefits:
Unlimited Question Access with detailed Answers
Zin AI - 3 Million Words
10 Dall-E 3 Images
20 Plot Generations
Conversation with Dialogue Memory
No Ads, Ever!
Access to Our Best AI Platform: Zin AI - Your personal assistant for all your inquiries!