Context: Your team has just been hired by HP Inc in its capital budgeting division....
60.1K
Verified Solution
Link Copied!
Question
Finance
Context:
Your team has just been hired by HP Inc in its capital budgeting division. Your first assignment is to determine the net cash flows and NPV of a proposed new project. HP is planning to develop a new type of smartphone, which should be able to compete with the latest Apple and Samsung models on the market.
Over the last two years, HP has already spent $150 million on R&D to optimize the design of the new smartphone. If the company would decide to actually go ahead with the project, the development and production of the new phone will initially require an investment equal to 42% of the companys current net property, plant and equipment (PPE), as per the fiscal year ended 31 October 2020. The project will then require an additional investment equal to 34% of the initial investment after the first year of the project. The smartphone is expected to have a life of five years. The expectation is that the property, plant and equipment can be sold at the end of the project with a liquidation value of about 10% of the initial investment. The company will borrow $100 million to (partly) finance this project, at an interest rate equal to the average cost of debt of the company.
First-year revenue for the new product is expected to be 3.6% of total revenue for HPs fiscal year ended 31 October 2020. The phones revenue is expected to grow at 75% for the second year, then 20% for the third, and after that decline by 5% annually for the final two years of the expected life of the product. Your team will have to determine the rest of the cash flows associated with this project. Your boss has indicated that the operating costs of this project will be similar to the rest of the companys products. After the end of the first year the net working capital will have to be adjusted for this project. After that, net working capital will remain at the same level until the end of the project, when the NWC will be re-adjusted to its original values before the start of the project. Your boss has suggested that the increase in accounts payable related to this project, at the end of the first year, will be similar to the rest of the companys products. However, the inventory requirements and account receivable requirements are expected to be 35% higher compared to the companys other products. Your boss did not say anything about depreciation of the PPE investments, so your team will have to decide on how the company will depreciate the PPE investments for this project. Since your boss hasnt been of much help, here are some tips to guide your analyses:
Obtain HPs (ticker code: HPQ) financial statements. Download the annual income statements, balance sheet and cash flow statements for the last four fiscal years. For example, find HPs financial statements on investing.com, and click on Financials. Make sure to get the annual financial statements, instead of the quarterly.
2) You are now ready to determine the free cash flow. Compute the free cash flow for each year. Set up the timeline and computation of the free cash flow in separate columns for each year of the project life. Be sure to make outflows negative and inflows positive.
a. To estimate the annual operating costs of the project, assume, as your boss indicated, that the projects profitability, the ratio of Revenue / Operating costs (Operating costs may also be labelled as Costs of Revenue) will be similar to HPs existing projects in 2020.
b. Determine HPs tax rate by dividing its income taxes by its income before tax in 2020.
c. Determine the change in net working capital attributable to the project by considering the level of inventory, accounts receivable and accounts payable as a percentage of revenues. For example, use HPs 2020 Inventory / Revenues to estimate the required percentages. (Use only accounts receivable, accounts payable and inventory to measure working capital. Other components of current assets and liabilities are harder to interpret and are not necessarily reflective of the projects required net working capital e.g. HPs cash holdings).
3) Assume that the projects cost of capital will be equal to the companys WACC. Determine HPs weighted average cost of capital (WACC). The CFO of the company computes HPs cost of debt by dividing the yearly interest expenses by the total outstanding long-term debt of the company, and she estimates the firms cost of equity using the CAPM (as discussed in Week 8). Your team will have to follow this method.
Income Statement:
Balance Sheet:
Cash flow:
*This is the whole document. I attached income statement, balance sheet and cash flow for you to refer. I need help with Question 3(WACC).
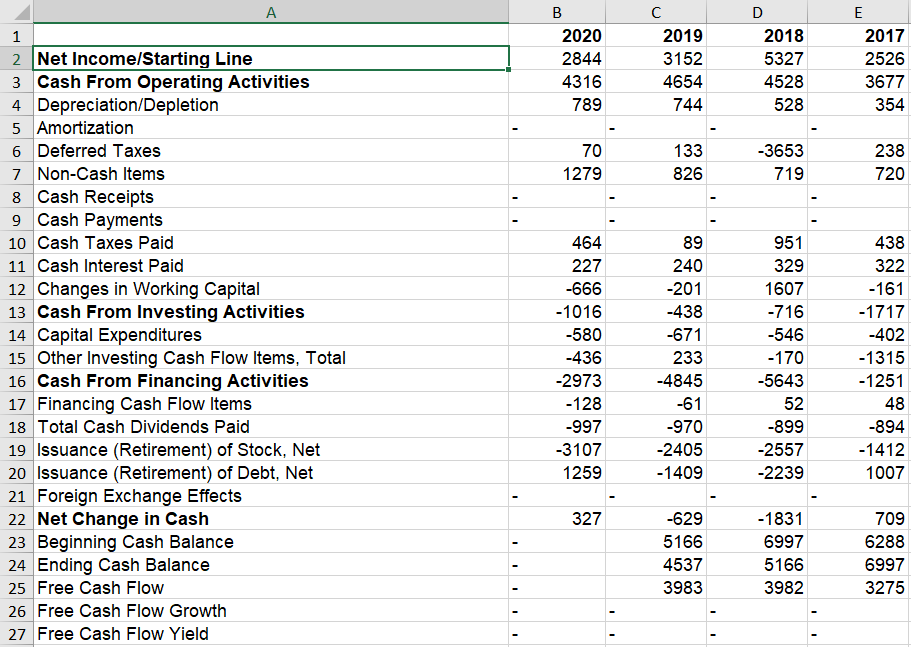
B C F G H 1 2020 2019 2018 2017 56639 58756 58472 52056 56639 58756 58472 52056 4 10437 11170 9578 48688 53217 10669 54767 5099 54879 4906 5368 4532 1404 1190 1478 113 1499 116 80 1 518 310 381 487 3422 3705 3368 3877 -347 -239 -286 -338 48 -406 246 -1007 2523 3231 3013 3276 2 Total Revenue: 3 Revenue Other Revenue, Total 5 Gross Profit 6 Total Operating Expenses 7 Selling/General/Admin. Expenses, Total 8 Research & Development 9 Depreciation / Amortization 10 Interest Expense (Income) - Net Operating 11 Unusual Expense (Income) 12 Other Operating Expenses, Total 13 Operating Income 14 Interest Income (Expense), Net Non-Operating 15 Gain (Loss) on Sale of Assets 16 Other, Net 17 Net Income Before Taxes 18 Provision for Income Taxes 19 Net Income After Taxes 20 Minority Interest 21 Equity In Affiliates 22 US GAAP Adjustment 23 Net Income Before Extraordinary Items 24 Total Extraordinary Items 25 Net Income 26 Total Adjustments to Net Income 27 Income Available to Common Excluding Extraordinary Items 28 Dilution Adjustment 29 Diluted Net Income 30 Diluted Weighted Average Shares 31 Diluted EPS Excluding Extraordinary Items 32 DPS - Common Stock Primary Issue 33 Diluted Normalized EPS -551 150 387 2844 750 2526 3074 2863 2844 3074 2526 2863 2464 - 78 2844 3152 5327 2526 2844 3074 2863 2526 2844 3152 5327 1420 1524 2526 1702 1.48 2 2.02 1634 1.75 0.56 1.97 0.7 0.64 0.53 2.32 2.15 1.7 B D D E 1 2020 20648 5138 2019 20177 4537 2018 21387 5877 2017 22318 8146 4537 5166 711 8003 5113 6062 8939 6031 5734 6997 1149 7162 4414 5786 B 4864 274 - 8443 5381 5963 1104 - 4440 34681 3734 8448 -4714 6380 540 967 33467 2794 7037 -4243 6372 661 - 102 42 3319 1445 34622 2198 6109 -3911 5968 1224 32913 1878 5958 -4080 5622 89 953 4027 98 1695 1302 3379 26220 14704 25293 14793 25131 14816 22412 13279 2 Total Current Assets 3 Cash and Short Term Investments 4 Cash 5 Cash & Equivalents 6 Short Term Investments 7 Total Receivables, Net Accounts Receivables - Trade, Net 9 Total Inventory 10 Prepaid Expenses 11 Other Current Assets, Total 12 Total Assets 13 Property/Plant/Equipment, Total - Net 14 Property/Plant/Equipment, Total - Gross 15 Accumulated Depreciation, Total 16 Goodwill, Net 17 Intangibles, Net 18 Long Term Investments 19 Note Receivable - Long Term 20 Other Long Term Assets, Total 21 Other Assets, Total 22 Total Current Liabilities 23 Accounts Payable 24 Payable/Accrued 25 Accrued Expenses 25 Notes Payable/Short Term Debt 27 Current Port of LT Debt/Capital Leases 28 Other Current liabilities, Total 29 Total Liabilities 30 Total Long Term Debt 31 Long Term Debt 32 Capital Lease Obligations 33 Deferred Income Tax 34 Minority Interest 35 Other Liabilities, Total 36 Total Equity 37 Redeemable Preferred Stock, Total 38 Preferred Stock - Non Redeemable, Net 39 Common Stock, Total 40 Additional Paid-In Capital 41 Retained Earnings (Accumulated Deficit) 42 Treasury Stock - Common 43 ESOP Debt Guarantee 44 Unrealized Gain (Loss) 45 Other Equity, Total 45 Total Liabilities & Shareholders' Equ 47 Total Common Shares Outstanding 48 Total Preferred Shares Outstanding .. 9411 41 633 1431 36909 5543 5543 8590 50 307 1553 34660 4780 4780 7297 898 565 1555 35261 4524 4524 6575 976 96 1486 36321 6747 6747 25 60 100 1410 5121 -2228 4527 -1193 5506 -639 5752 -3408 13 963 -1961 15 835 -818 16 663 -473 16 380 -2386 11 -1254 34681 1304 9 -1234 33467 1458 5 -850 34622 1560.27 12 -1430 32913 1649.58 A B D E 2020 2019 2018 2017 2844 3152 2526 1 2 Net Income/Starting Line 3 Cash From Operating Activities 4 Depreciation/Depletion 5 Amortization 5327 4528 4316 4654 3677 789 744 528 354 6 Deferred Taxes 70 133 -3653 238 720 1279 826 719 7 Non-Cash Items 8 Cash Receipts 9 Cash Payments 10 Cash Taxes Paid 951 438 89 240 329 322 464 227 -666 -1016 1607 -161 -201 -438 -671 -716 -1717 -402 -580 -546 -436 233 -170 -5643 -4845 -1315 - 1251 48 -2973 - 128 -997 -61 11 Cash Interest Paid 12 Changes in Working Capital 13 Cash From Investing Activities 14 Capital Expenditures 15 Other Investing Cash Flow Items, Total 16 Cash From Financing Activities 17 Financing Cash Flow Items 18 Total Cash Dividends Paid 19 Issuance (Retirement) of Stock, Net 20 Issuance (Retirement) of Debt, Net 21 Foreign Exchange Effects 22 Net Change in Cash 23 Beginning Cash Balance 24 Ending Cash Balance 25 Free Cash Flow 52 -970 -894 -899 -2557 -3107 -2405 -1412 1259 -1409 -2239 1007 327 -629 -1831 709 5166 6997 6288 6997 4537 5166 3983 3982 3275 26 Free Cash Flow Growth 27 Free Cash Flow Yield I B C F G H 1 2020 2019 2018 2017 56639 58756 58472 52056 56639 58756 58472 52056 4 10437 11170 9578 48688 53217 10669 54767 5099 54879 4906 5368 4532 1404 1190 1478 113 1499 116 80 1 518 310 381 487 3422 3705 3368 3877 -347 -239 -286 -338 48 -406 246 -1007 2523 3231 3013 3276 2 Total Revenue: 3 Revenue Other Revenue, Total 5 Gross Profit 6 Total Operating Expenses 7 Selling/General/Admin. Expenses, Total 8 Research & Development 9 Depreciation / Amortization 10 Interest Expense (Income) - Net Operating 11 Unusual Expense (Income) 12 Other Operating Expenses, Total 13 Operating Income 14 Interest Income (Expense), Net Non-Operating 15 Gain (Loss) on Sale of Assets 16 Other, Net 17 Net Income Before Taxes 18 Provision for Income Taxes 19 Net Income After Taxes 20 Minority Interest 21 Equity In Affiliates 22 US GAAP Adjustment 23 Net Income Before Extraordinary Items 24 Total Extraordinary Items 25 Net Income 26 Total Adjustments to Net Income 27 Income Available to Common Excluding Extraordinary Items 28 Dilution Adjustment 29 Diluted Net Income 30 Diluted Weighted Average Shares 31 Diluted EPS Excluding Extraordinary Items 32 DPS - Common Stock Primary Issue 33 Diluted Normalized EPS -551 150 387 2844 750 2526 3074 2863 2844 3074 2526 2863 2464 - 78 2844 3152 5327 2526 2844 3074 2863 2526 2844 3152 5327 1420 1524 2526 1702 1.48 2 2.02 1634 1.75 0.56 1.97 0.7 0.64 0.53 2.32 2.15 1.7 B D D E 1 2020 20648 5138 2019 20177 4537 2018 21387 5877 2017 22318 8146 4537 5166 711 8003 5113 6062 8939 6031 5734 6997 1149 7162 4414 5786 B 4864 274 - 8443 5381 5963 1104 - 4440 34681 3734 8448 -4714 6380 540 967 33467 2794 7037 -4243 6372 661 - 102 42 3319 1445 34622 2198 6109 -3911 5968 1224 32913 1878 5958 -4080 5622 89 953 4027 98 1695 1302 3379 26220 14704 25293 14793 25131 14816 22412 13279 2 Total Current Assets 3 Cash and Short Term Investments 4 Cash 5 Cash & Equivalents 6 Short Term Investments 7 Total Receivables, Net Accounts Receivables - Trade, Net 9 Total Inventory 10 Prepaid Expenses 11 Other Current Assets, Total 12 Total Assets 13 Property/Plant/Equipment, Total - Net 14 Property/Plant/Equipment, Total - Gross 15 Accumulated Depreciation, Total 16 Goodwill, Net 17 Intangibles, Net 18 Long Term Investments 19 Note Receivable - Long Term 20 Other Long Term Assets, Total 21 Other Assets, Total 22 Total Current Liabilities 23 Accounts Payable 24 Payable/Accrued 25 Accrued Expenses 25 Notes Payable/Short Term Debt 27 Current Port of LT Debt/Capital Leases 28 Other Current liabilities, Total 29 Total Liabilities 30 Total Long Term Debt 31 Long Term Debt 32 Capital Lease Obligations 33 Deferred Income Tax 34 Minority Interest 35 Other Liabilities, Total 36 Total Equity 37 Redeemable Preferred Stock, Total 38 Preferred Stock - Non Redeemable, Net 39 Common Stock, Total 40 Additional Paid-In Capital 41 Retained Earnings (Accumulated Deficit) 42 Treasury Stock - Common 43 ESOP Debt Guarantee 44 Unrealized Gain (Loss) 45 Other Equity, Total 45 Total Liabilities & Shareholders' Equ 47 Total Common Shares Outstanding 48 Total Preferred Shares Outstanding .. 9411 41 633 1431 36909 5543 5543 8590 50 307 1553 34660 4780 4780 7297 898 565 1555 35261 4524 4524 6575 976 96 1486 36321 6747 6747 25 60 100 1410 5121 -2228 4527 -1193 5506 -639 5752 -3408 13 963 -1961 15 835 -818 16 663 -473 16 380 -2386 11 -1254 34681 1304 9 -1234 33467 1458 5 -850 34622 1560.27 12 -1430 32913 1649.58 A B D E 2020 2019 2018 2017 2844 3152 2526 1 2 Net Income/Starting Line 3 Cash From Operating Activities 4 Depreciation/Depletion 5 Amortization 5327 4528 4316 4654 3677 789 744 528 354 6 Deferred Taxes 70 133 -3653 238 720 1279 826 719 7 Non-Cash Items 8 Cash Receipts 9 Cash Payments 10 Cash Taxes Paid 951 438 89 240 329 322 464 227 -666 -1016 1607 -161 -201 -438 -671 -716 -1717 -402 -580 -546 -436 233 -170 -5643 -4845 -1315 - 1251 48 -2973 - 128 -997 -61 11 Cash Interest Paid 12 Changes in Working Capital 13 Cash From Investing Activities 14 Capital Expenditures 15 Other Investing Cash Flow Items, Total 16 Cash From Financing Activities 17 Financing Cash Flow Items 18 Total Cash Dividends Paid 19 Issuance (Retirement) of Stock, Net 20 Issuance (Retirement) of Debt, Net 21 Foreign Exchange Effects 22 Net Change in Cash 23 Beginning Cash Balance 24 Ending Cash Balance 25 Free Cash Flow 52 -970 -894 -899 -2557 -3107 -2405 -1412 1259 -1409 -2239 1007 327 -629 -1831 709 5166 6997 6288 6997 4537 5166 3983 3982 3275 26 Free Cash Flow Growth 27 Free Cash Flow Yield
Answer & Explanation
Solved by verified expert
Get Answers to Unlimited Questions
Join us to gain access to millions of questions and expert answers. Enjoy exclusive benefits tailored just for you!
Membership Benefits:
Unlimited Question Access with detailed Answers
Zin AI - 3 Million Words
10 Dall-E 3 Images
20 Plot Generations
Conversation with Dialogue Memory
No Ads, Ever!
Access to Our Best AI Platform: Zin AI - Your personal assistant for all your inquiries!