Calculate:For debt: Debt-to-Assets Ratio, Debt-to-Equity Ratio, Debt-to-Capital Ratio, Debt-to-EBITDA Ratio, Asset-to-Equity Ratio and for market...
90.2K
Verified Solution
Link Copied!
Question
Finance
Calculate:For debt: Debt-to-Assets Ratio, Debt-to-Equity Ratio, Debt-to-Capital Ratio, Debt-to-EBITDA Ratio, Asset-to-Equity Ratio and for market ratios: Price/Earnings or PE Ratio, Earnings per Share, Book Value per Share, Market Value per Share, Dividend Yield, Market to Book Ratio
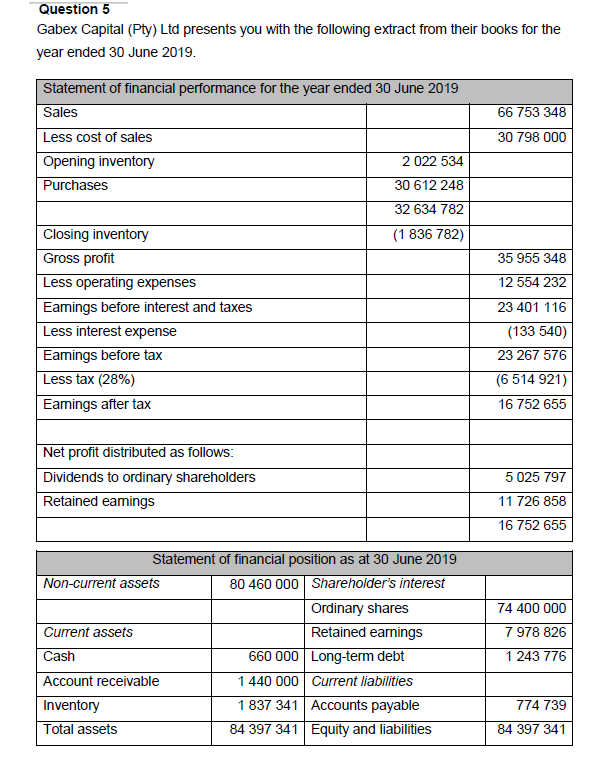
Question 5 Gabex Capital (Pty) Ltd presents you with the following extract from their books for the year ended 30 June 2019. Statement of financial performance for the year ended 30 June 2019 Sales 66 753 348 30 798 000 Less cost of sales Opening inventory Purchases 2 022 534 30 612 248 32 634 782 (1 836 782) Closing inventory Gross profit Less operating expenses Eamings before interest and taxes Less interest expense Eamings before tax Less tax (28%) Earings after tax 35 955 348 12 554 232 23 401 116 (133 540) 23 267 576 (6 514 921) 16 752 655 Net profit distributed as follows: Dividends to ordinary shareholders Retained earings 5 025 797 11 726 858 16 752 655 Statement of financial position as at 30 June 2019 Non-current assets 80 460 000 Shareholder's interest Ordinary shares Current assets Retained earnings Cash 660 000 Long-term debt Account receivable 1 440 000 Current liabilities Inventory 1 837 341 Accounts payable Total assets 84 397 341 Equity and liabilities 74 400 000 7 978 826 1 243 776 774 739 84 397 341 Additional information Number of ordinary shares issued Current market price per share 74 400 000 @ 100 cents each 4 368 cents Industrial averages Ratio EPS DPS PIE Debt ratio Debt-equity ratio Times interest ratio PIE Industrial average 180 cents 45 cents 11 10% 20% 25 Required: Calculate and interpret the basic debt and securities market ratios of a firm based on the above financial statements. State all ratios/formulas before doing the calculation and show all your calculations. Question 5 Gabex Capital (Pty) Ltd presents you with the following extract from their books for the year ended 30 June 2019. Statement of financial performance for the year ended 30 June 2019 Sales 66 753 348 30 798 000 Less cost of sales Opening inventory Purchases 2 022 534 30 612 248 32 634 782 (1 836 782) Closing inventory Gross profit Less operating expenses Eamings before interest and taxes Less interest expense Eamings before tax Less tax (28%) Earings after tax 35 955 348 12 554 232 23 401 116 (133 540) 23 267 576 (6 514 921) 16 752 655 Net profit distributed as follows: Dividends to ordinary shareholders Retained earings 5 025 797 11 726 858 16 752 655 Statement of financial position as at 30 June 2019 Non-current assets 80 460 000 Shareholder's interest Ordinary shares Current assets Retained earnings Cash 660 000 Long-term debt Account receivable 1 440 000 Current liabilities Inventory 1 837 341 Accounts payable Total assets 84 397 341 Equity and liabilities 74 400 000 7 978 826 1 243 776 774 739 84 397 341 Additional information Number of ordinary shares issued Current market price per share 74 400 000 @ 100 cents each 4 368 cents Industrial averages Ratio EPS DPS PIE Debt ratio Debt-equity ratio Times interest ratio PIE Industrial average 180 cents 45 cents 11 10% 20% 25 Required: Calculate and interpret the basic debt and securities market ratios of a firm based on the above financial statements. State all ratios/formulas before doing the calculation and show all your calculations
Answer & Explanation
Solved by verified expert
Get Answers to Unlimited Questions
Join us to gain access to millions of questions and expert answers. Enjoy exclusive benefits tailored just for you!
Membership Benefits:
Unlimited Question Access with detailed Answers
Zin AI - 3 Million Words
10 Dall-E 3 Images
20 Plot Generations
Conversation with Dialogue Memory
No Ads, Ever!
Access to Our Best AI Platform: Zin AI - Your personal assistant for all your inquiries!