70.2K
Verified Solution
 Link Copied!


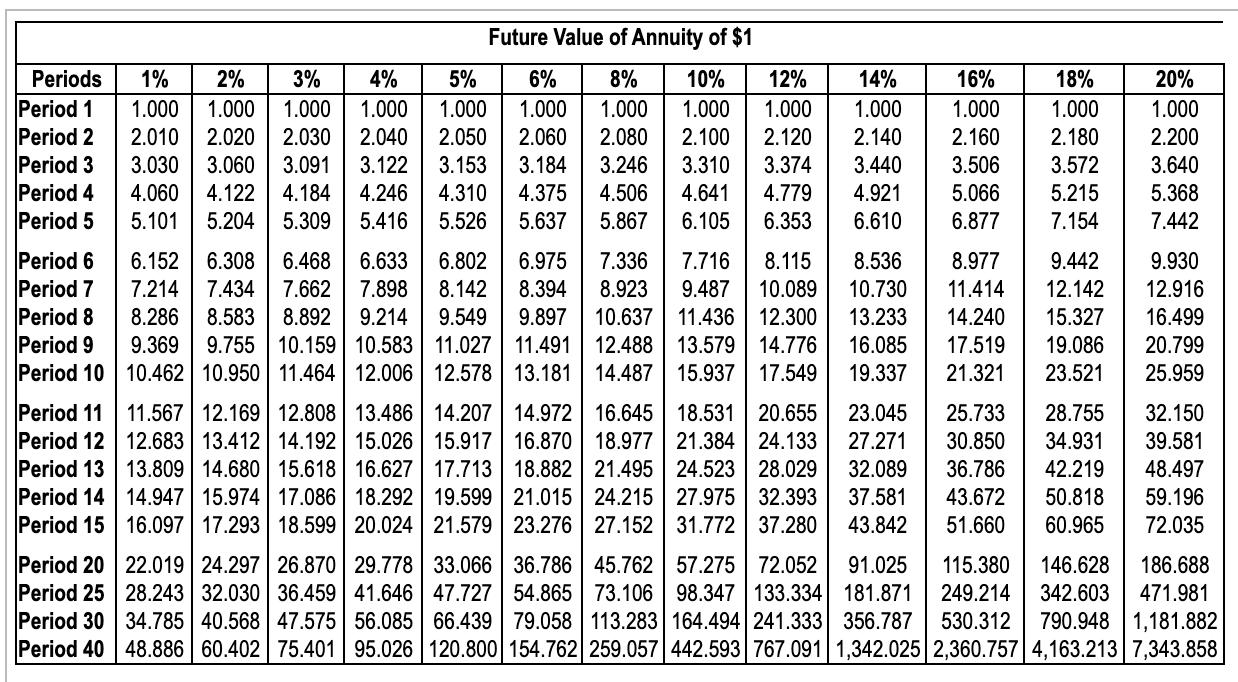

Berkner Industries is deciding whether to automate one phase of its production process. The manufacturing equipment has a six-year life and will cost $900,000. Projected net cash inflows are as follows: (Click the icon to view the projected net cash inflows.) (Click the icon to view the present value table.) (Click the icon to view the present value annuity table.) (Click the icon to view the future value table.) (Click the icon to view the future value annuity table.) Read the requirements. Requirement 1. Compute this project's NPV using Berkner Industries' 16% hurdle rate. Should Berkner Industries invest in the equipment? Why or why not? Begin by computing the project's NPV (net present value). (Round your answer to the nearest whole dollar. Use parentheses or a minus sign for negative net present values.) Net present value Year 1 Year 2 Year 3 $262,000 $252,000 $227,000 $212,000 $201,000 $175,000 Year 4 Year 5 Year 6 Present Value of $1 Periods Period 1 Period 2 Period 3 Period 4 Period 5 1% 0.990 0.980 0.971 0.961 0.951 2% 0.980 0.961 0.942 0.924 0.906 3% 4% 0.971 0.962 0.943 0.925 0.915 0.889 0.888 0.855 0.863 0.822 5% 6% 8% 0.952 0.943 0.926 0.907 0.890 0.857 0.864 0.840 0.794 0.8230.792 0.735 0.784 0.747 0.681 10% 0.909 0.826 0.751 0.683 0.621 12% 14% 16% 18% 20% 0.893 0.877 0.862 0.847 0.833 0.797 0.769 0.743 0.7180.694 0.712 0.675 0.641 0.609 0.579 0.636 0.592 0.552 0.516 0.482 0.567 0.519 0.476 0.437 0.402 Period 6 0.942 Period 7 0.933 Period 8 0.923 Period 9 0.914 Period 10 0.905 0.888 0.871 0.853 0.837 0.820 0.837 0.790 0.813 0.760 0.789 0.731 0.766 0.703 0.744 0.676 0.746 0.705 0.630 0.7110.665 0.583 0.677 0.627 0.540 0.645 0.592 0.500 0.614 0.558 0.463 0.564 0.513 0.467 0.424 0.386 0.507 0.456 0.452 0.400 0.404 0.351 0.361 0.308 0.322 0.270 0.410 0.354 0.305 0.263 0.227 0.370 0.335 0.314 0.279 0.266 0.233 0.225 0.194 0.191 0.162 Period 11 0.896 Period 12 0.887 Period 13 0.879 Period 14 0.870 Period 15 0.861 0.804 0.788 0.773 0.758 0.743 0.722 0.650 0.701 0.625 0.681 0.601 0.661 0.577 0.642 0.555 0.585 0.527 0.429 0.557 0.497 0.397 0.530 0.4690.368 0.505 0.442 0.340 0.481 0.417 0.315 0.350 0.319 0.290 0.263 0.239 0.287 0.237 0.195 0.162 0.135 0.257 0.208 0.168 0.137 0.112 0.229 0.182 0.145 0.116 0.093 0.205 0.160 0.125 0.099 0.078 0.183 0.140 0.108 0.084 0.065 Period 20 0.820 0.673 0.554 0.456 Period 25 0.780 0.610 0.478 0.375 Period 30 0.742 0.5520.412 0.308 Period 40 0.672 0.453 0.307 0.208 0.377 0.3120.215 0.295 0.233 0.146 0.231 0.174 0.099 0.142 0.097 0.046 0.149 0.104 0.073 0.051 0.037 0.026 0.092 0.059 0.038 0.024 0.016 0.010 0.057 0.033 0.020 | 0.0120.007 0.004 0.022 0.011 0.005 0.003 0.001 0.001 1% 3% 5% Periods Period 1 Period 2 Period 3 Period 4 Period 5 Present Value of Annuity of $1 2% 4% 6% 8% 10% 12% 14% 0.990 0.980 0.971 0.962 0.9520.943 0.926 0.909 0.893 0.877 1.970 1.942 1.913 1.886 1.859 1.833 1.783 1.736 1.690 1.647 2.941 2.884 2.829 2.775 2.723 2.673 2.577 2.487 2.402 2.322 3.902 3.808 3.717 3.630 3.546 3.465 3.312 3.170 3.037 2.914 4.853 4.713 4.580 4.452 4.329 4.212 3.993 3.791 3.605 3.433 16% 0.862 1.605 2.246 2.798 3.274 18% 0.847 1.566 2.174 2.690 3.127 20% 0.833 1.528 2.106 2.589 2.991 Period 6 5.795 5.601 5.417 5.242 5.0764.917 4.623 4.355 4.111 3.889 Period 7 6.728 6.472 6.230 6.002 5.786 5.5825.206 4.868 4.564 4.288 Period 8 7.652 7.325 7.020 6.733 6.463 6.210 5.747 5.335 4.9684.639 Period 9 8.566 8.1627.786 7.435 7.108 6.802 6.247 5.759 5.328 4.946 Period 100 9.471 8.983 | 8.530 8.111 7.722 7.360 6.710 6.145 5.6505.216 3.685 4.039 4.344 4.607 4.833 3.498 3.812 4.078 4.303 4.494 3.326 3.605 3.837 4.031 4.192 Period 11 10.368 9.787 9.253 8.760 8.306 7.887 7.139 6.495 5.938 5.453 5.029 Period 12 11.255 10.575 9.954 9.385 8.863 8.384 7.536 6.814 6.194 5.660 5.197 Period 13) 12.134 11.348 10.635 9.986 9.394 8.853 7.904 7.103 6.424 5.842 5.342 Period 14 13.004 12.106 11.296 | 10.563 9.899 9.295 8.244 7.367 6.628 6.002 5.468 Period 15 13.865 12.849 11.938 11.118 10.380 9.712 8.559 7.606 6.811 6.142 5.575 Period 20 18.046 16.351 14.877 13.590 12.462 11.470 9.818 8.514 7.4696.623 5.929 Period 25 22.023 19.523 17.41315.622 14.094 12.783 10.675 9.077 7.843 6.873 6.097 Period 30 25.808 22.396 19.60017.292 15.372 13.765 11.258 9.4278.055 7.003 6.177 Period 40 32.835 27.355 23.115 19.793 17.159 15.046 11.925 9.779 8.244 7.105 6.233 4.656 4.793 4.910 5.008 5.092 4.327 4.439 4.533 4.611 4.675 5.353 5.467 5.517 5.548 4.870 4.948 4.979 4.997 14% 1.000 Periods Period 1 Period 2 Period 3 Period 4 Period 5 1% 1.000 2.010 3.030 4.060 5.101 2% 1.000 2.020 3.060 4.122 5.204 3% 1.000 2.030 3.091 4.184 5.309 4% 1.000 2.040 3.122 4.246 5.416 Future Value of Annuity of $1 5% 6% 8% 10% 1.000 1.000 1.000 1.000 2.050 2.060 2.080 2.100 3.153 3.184 3.246 3.310 4.310 4.375 4.506 4.641 5.526 5.637 5.867 6.105 12% 1.000 2.120 3.374 4.779 6.353 2.140 3.440 4.921 6.610 16% 1.000 2.160 3.506 5.066 6.877 18% 1.000 2.180 3.572 5.215 7.154 20% 1.000 2.200 3.640 5.368 7.442 Period 6 6.152 6.308 6.468 6.633 6.802 6.975 7.336 7.716 8.115 Period 7 7.214 7.434 7.662 7.898 8.142 8.394 8.923 9.487 10.089 Period 8 8.286 8.583 8.892 9.214 9.549 9.897 10.637 11.436 12.300 Period 9 9.369 9.755 10.159 10.583 11.027 11.491 12.488 13.579 14.776 Period 10 10.462 10.950 11.464 12.006 12.578 13.181 14.48715.937 17.549 8.536 10.730 13.233 16.085 19.337 8.977 11.414 14.240 17.519 21.321 9.442 12.142 15.327 19.086 23.521 9.930 12.916 16.499 20.799 25.959 Period 11 11.567 12.169 12.808 13.486 14.207 14.972 16.645 18.531 20.655 Period 12 12.683 13.412 14.192 15.026 15.917 16.870 18.977 | 21.384 24.133 Period 13 13.809 14.680 15.618 16.627 17.713 18.882 21.495 24.523 28.029 Period 14 14.947 15.974 17.086 | 18.292 19.599 21.015 | 24.215 27.975 32.393 Period 15 | 16.097 | 17.293 18.599 20.024 21.579 23.276 27.152 31.772 37.280 23.045 27.271 32.089 37.581 43.842 25.733 30.850 36.786 43.672 51.660 28.755 34.931 42.219 50.818 60.965 32.150 39.581 48.497 59.196 72.035 Period 20 22.019 24.297 26.870 29.778 33.066 36.786 45.762 57.275 72.052 91.025 115.380 146.628 186.688 Period 25 28.243 32.03036.459 41.646 47.727 54.865 73.106 98.347 133.334 181.871 249.214 342.603 471.981 Period 30 34.785 40.568 47.575 56.085 66.439 79.058 113.283 164.494 241.333 356.787 530.312 790.948 1,181.882 Period 40 48.886 60.402 75.401 95.026 120.800 154.762 259.057 442.593 767.091|1,342.025 2,360.757 4,163.213 7,343.858 1. Compute this project's NPV using Berkner Industries' 16% hurdle rate. Should the company invest in the equipment? Why or why not? 2. Berkner Industries could refurbish the equipment at the end of six years for $100,000. The refurbished equipment could be used one more year, providing $75,000 of net cash inflows in Year 7. In addition, the refurbished equipment would have a $54,000 residual value at the end of Year 7. Should Berkner Industries invest in the equipment and refurbish it after six years? Why or why not? (Hint: In addition to your answer to Requirement 1, discount the additional cash outflow and inflows back to the present value.)
Answer & Explanation
Solved by verified expert
