
Transcribed Image Text
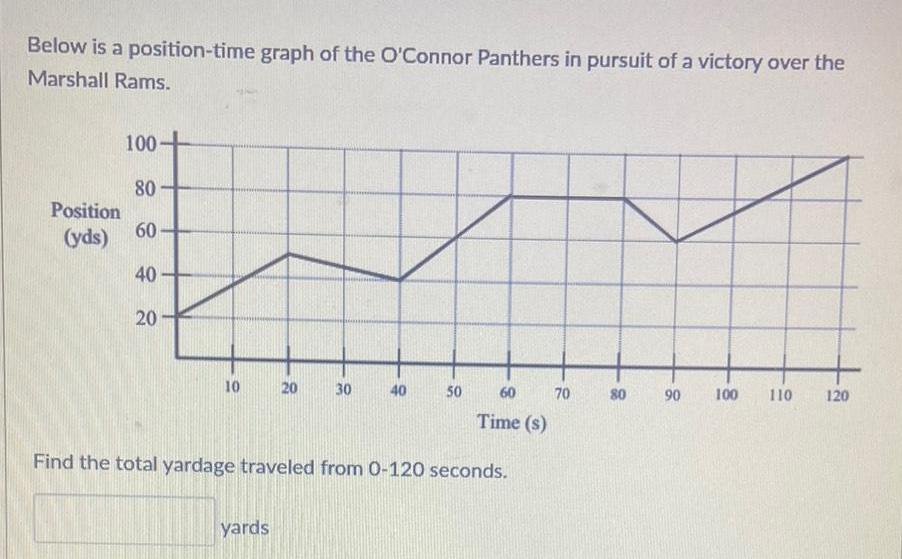
Below is a position time graph of the O Connor Panthers in pursuit of a victory over the Marshall Rams Position yds 100 80 60 40 20 10 20 yards 30 40 50 60 Time s Find the total yardage traveled from 0 120 seconds 70 80 90 100 110 120
Other questions asked by students
What are the positive sides of Micro Finance impacts on economic growth
Given that K a1 =5.9 x 10 −3 and K a2 =6.0x10 −6, calculate the pH after...
Two species cannot occupy the same niche in a habitat. This is referred toas the...
Persons preparing and signing the Pick up Request Form are required to take the following...
Robert Schumann's wife loved the 2nd Movement of his"Fantasie in C Major" and urged him...
One end of a long string of linear mass density 8 0 x 10 kg...
The given contingency table lists the cross tabulation of whether adults for whom answering the...
If the value of "y" varies directly with "x" and y=-51 when x = 3,...
3 Given a mean of 52 3 and a standard deviation of 1 8 what...