Because you are reading this after the end of Ethan Allens fiscal year 2017, how...
80.2K
Verified Solution
Link Copied!
Question
Finance
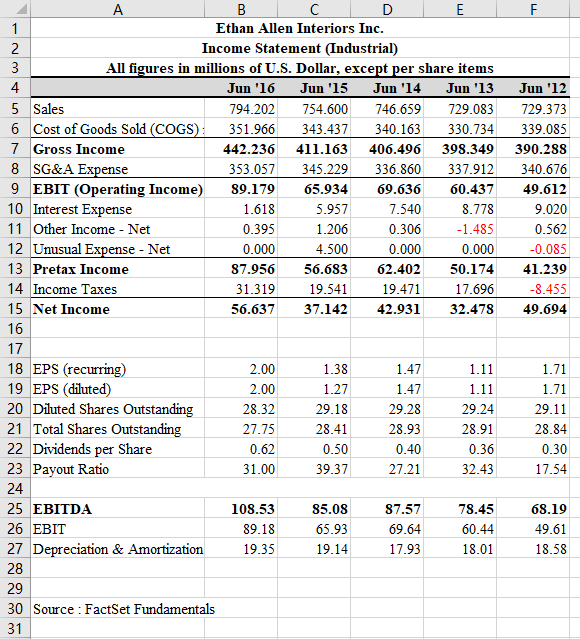
Because you are reading this after the end of Ethan Allens fiscal year 2017, how do your forecasts from the previous problems compare to the actual FY 2017 results? Does it appear that more information would have helped to generate better forecasts? Insert the actual sales for 2017 into your forecast. Does this improve your forecast of earnings?
Ethan Allen Interiors Inc Income Statement (Industrial) All figures in millions of U.S. Dollar, except per share items 4 5 Sales Jun '12 794.202754.600 746.659729.083 729.373 6 Cost of Goods Sold (COGS):351.966 343.437 340.163 330.734 339.085 442.236 411.163406.496 398.349390.288 353.057345.229336.860337.912340.676 9 EBIT (Operating Income) 89.1795.93469.63660.43749.612 9.020 Jun '16 Jun '15 Jun '14 Jun '13 7 Gross Income 8 SG&A Expense 10 Interest Expense 11 Other Income - Net 12 Unusual Expense Net 13 Pretax Income 14 Income Taxes 15 Net Income 5.957 1.206 4.500 7.540 0.306 0.000 1.618 0.395 0.000 8.778 1.485 0.000 0.562 0.085 87.95656.68362.402 50.17441.239 8.455 56.63737.14242.931 32.47849.694 31.319 19.541 19.471 17.696 18 EPS (recurring) 19 EPS (dluted) 20 Dluted Shares Outstanding 21 Total Shares Outstanding 22 Dividends per Share 23 Payout Ratio 24 25 EBITDA 26 EBIT 27 Depreciation& Amortization 28 29 30 Source : FactSet Fundamentals 31 1.71 1.71 29.11 28.84 0.30 17.54 1.27 29.18 28.41 0.50 39.37 1.11 29.24 28.91 0.36 32.43 28.32 27.75 0.62 31.00 29.28 28.93 0.40 27.21 68.19 49.61 18.58 108.53 89.18 19.35 85.08 65.93 19.14 87.57 69.64 17.93 78.45 60.44 18.01 Ethan Allen Interiors Inc. Balance Sheet (Industrial) All figures in millions of U.S. Dollar, except per share items Jun '16 Jun '15 Jun '14 Jun '13 Jun '12 Assets Cash Only Total Short Term Investments Short-Term Receivables Inventories Other Current Assets Total Current Assets Property, Plant & Equipment - Gross Accumul Net Property, Plant & Equipment Other Long-Term Assets Total Assets 52.659 76.18210917672.60179.721 9.005 9.4672.54712.42612.27714.919 162.323151.916 146.275137.256 155.739 23.408 248.204 270.674 305.29260.570 282.792 598.264594.912 601.709594.385587.368 324.649317.877 313.553 302.713 291.673 273.615 277.035 288.156291.672 295.695 66.301 577.409 607.308654.434617.285 644.788 0.000 2.19818.15315.529 23.755 959922.907 27.831 ated Depreciation 55.590 59.599 65.043 60.649 Liabilities & Shareholders' Equity ST Debt & Curr. Portion LT Debt Accounts Payable Other Current Liabiities Total Current Liabilities 0.250 15.43718.946 24.32022.995 27.315 104.909 118.682 111.226109.464123.512 123.347 140.969136.047 132.939 151.077 38.837 74.227 130.41130.809 154.250 17.593 185.207 236.773286.967 282.928322.920 0.485 374.972370.914 365.733 363.938 361.165 646.315 607.079 584.395553.083 542.918 629.574 607.947583.147583.150582.700 392.202 370.535 367.467 334.357321.868 577.409 607.308654.434617.285 644.788 0.501 0.480 3.001 3.341 Long-Tem Debt Other Liabilities Total Liabilities Common Stock Par/Carry Value Additional Paid-In Capital Capital Surplus Retained Earnings Treasury Stock and Other Deductions from E Total Shareholders Equit Total Liabilities & Shareholders Equity 23.023 21.577 20.509 19.180 0.489 0.489 0.486 0.486 Ethan Allen Interiors Inc Income Statement (Industrial) All figures in millions of U.S. Dollar, except per share items 4 5 Sales Jun '12 794.202754.600 746.659729.083 729.373 6 Cost of Goods Sold (COGS):351.966 343.437 340.163 330.734 339.085 442.236 411.163406.496 398.349390.288 353.057345.229336.860337.912340.676 9 EBIT (Operating Income) 89.1795.93469.63660.43749.612 9.020 Jun '16 Jun '15 Jun '14 Jun '13 7 Gross Income 8 SG&A Expense 10 Interest Expense 11 Other Income - Net 12 Unusual Expense Net 13 Pretax Income 14 Income Taxes 15 Net Income 5.957 1.206 4.500 7.540 0.306 0.000 1.618 0.395 0.000 8.778 1.485 0.000 0.562 0.085 87.95656.68362.402 50.17441.239 8.455 56.63737.14242.931 32.47849.694 31.319 19.541 19.471 17.696 18 EPS (recurring) 19 EPS (dluted) 20 Dluted Shares Outstanding 21 Total Shares Outstanding 22 Dividends per Share 23 Payout Ratio 24 25 EBITDA 26 EBIT 27 Depreciation& Amortization 28 29 30 Source : FactSet Fundamentals 31 1.71 1.71 29.11 28.84 0.30 17.54 1.27 29.18 28.41 0.50 39.37 1.11 29.24 28.91 0.36 32.43 28.32 27.75 0.62 31.00 29.28 28.93 0.40 27.21 68.19 49.61 18.58 108.53 89.18 19.35 85.08 65.93 19.14 87.57 69.64 17.93 78.45 60.44 18.01 Ethan Allen Interiors Inc. Balance Sheet (Industrial) All figures in millions of U.S. Dollar, except per share items Jun '16 Jun '15 Jun '14 Jun '13 Jun '12 Assets Cash Only Total Short Term Investments Short-Term Receivables Inventories Other Current Assets Total Current Assets Property, Plant & Equipment - Gross Accumul Net Property, Plant & Equipment Other Long-Term Assets Total Assets 52.659 76.18210917672.60179.721 9.005 9.4672.54712.42612.27714.919 162.323151.916 146.275137.256 155.739 23.408 248.204 270.674 305.29260.570 282.792 598.264594.912 601.709594.385587.368 324.649317.877 313.553 302.713 291.673 273.615 277.035 288.156291.672 295.695 66.301 577.409 607.308654.434617.285 644.788 0.000 2.19818.15315.529 23.755 959922.907 27.831 ated Depreciation 55.590 59.599 65.043 60.649 Liabilities & Shareholders' Equity ST Debt & Curr. Portion LT Debt Accounts Payable Other Current Liabiities Total Current Liabilities 0.250 15.43718.946 24.32022.995 27.315 104.909 118.682 111.226109.464123.512 123.347 140.969136.047 132.939 151.077 38.837 74.227 130.41130.809 154.250 17.593 185.207 236.773286.967 282.928322.920 0.485 374.972370.914 365.733 363.938 361.165 646.315 607.079 584.395553.083 542.918 629.574 607.947583.147583.150582.700 392.202 370.535 367.467 334.357321.868 577.409 607.308654.434617.285 644.788 0.501 0.480 3.001 3.341 Long-Tem Debt Other Liabilities Total Liabilities Common Stock Par/Carry Value Additional Paid-In Capital Capital Surplus Retained Earnings Treasury Stock and Other Deductions from E Total Shareholders Equit Total Liabilities & Shareholders Equity 23.023 21.577 20.509 19.180 0.489 0.489 0.486 0.486
Answer & Explanation
Solved by verified expert
Get Answers to Unlimited Questions
Join us to gain access to millions of questions and expert answers. Enjoy exclusive benefits tailored just for you!
Membership Benefits:
Unlimited Question Access with detailed Answers
Zin AI - 3 Million Words
10 Dall-E 3 Images
20 Plot Generations
Conversation with Dialogue Memory
No Ads, Ever!
Access to Our Best AI Platform: Zin AI - Your personal assistant for all your inquiries!