
Transcribed Image Text
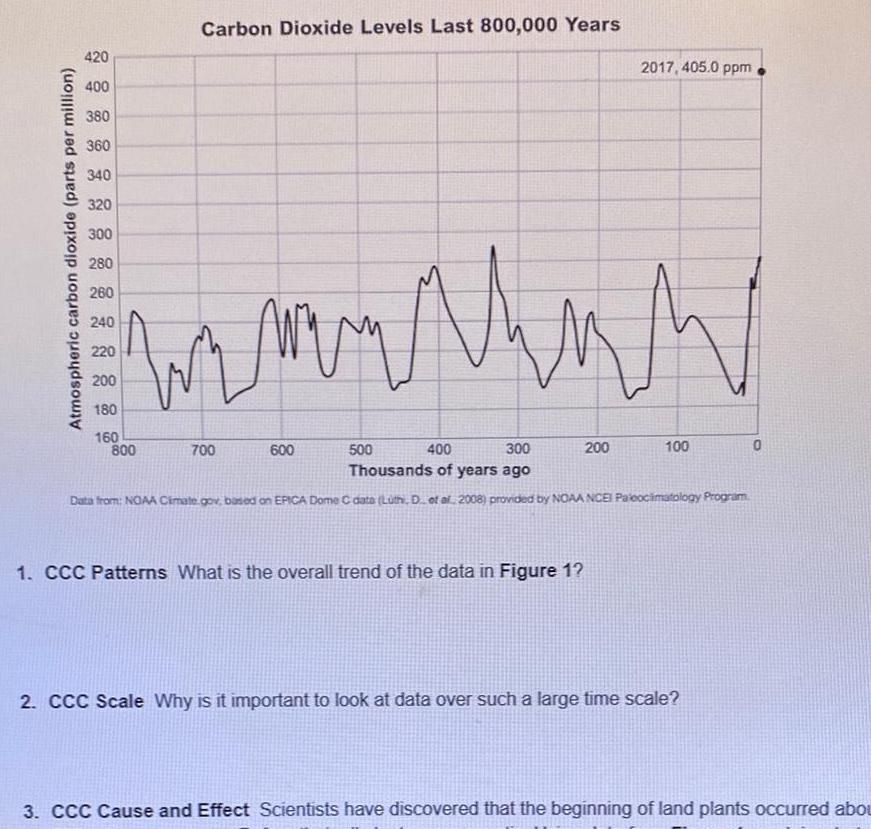
Atmospheric carbon dioxide parts per million 420 400 380 360 340 320 300 280 260 240 220 200 180 160 Carbon Dioxide Levels Last 800 000 Years wzman 800 anthaw 700 400 300 Thousands of years ago Data from NOAA Cimate gov based on EPICA Dome C data Luth D et al 2008 provided by NOAA NCEI Paleoclimatology Program 600 500 2017 405 0 ppm 1 CCC Patterns What is the overall trend of the data in Figure 1 200 100 2 CCC Scale Why is it important to look at data over such a large time scale 0 3 CCC Cause and Effect Scientists have discovered that the beginning of land plants occurred abou
Other questions asked by students
Accounting
Accounting
Q
Problem 7.29 LO7 Bonds payable-callable Hayden Co. has outstanding $40 million face amount of 7%...
Accounting
Accounting