
Transcribed Image Text
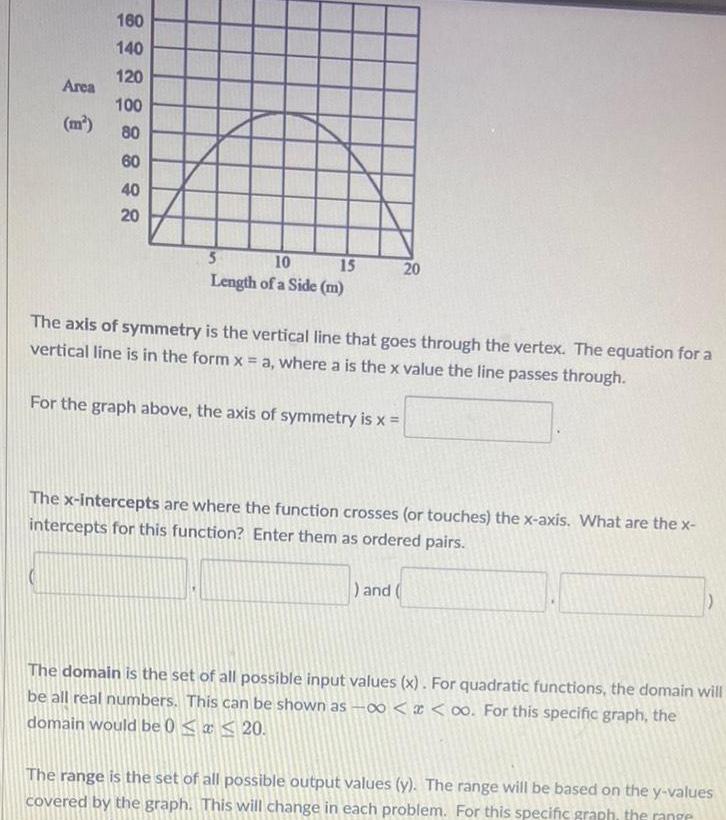
Area m 160 140 120 100 8878 80 60 40 20 5 10 15 Length of a Side m 20 The axis of symmetry is the vertical line that goes through the vertex The equation for a vertical line is in the form x a where a is the x value the line passes through For the graph above the axis of symmetry is x The x intercepts are where the function crosses or touches the x axis What are the x intercepts for this function Enter them as ordered pairs and The domain is the set of all possible input values x For quadratic functions the domain will be all real numbers This can be shown as o For this specific graph the domain would be 0 x 20 The range is the set of all possible output values y The range will be based on the y values covered by the graph This will change in each problem For this specific graph the range