Transcribed Image Text
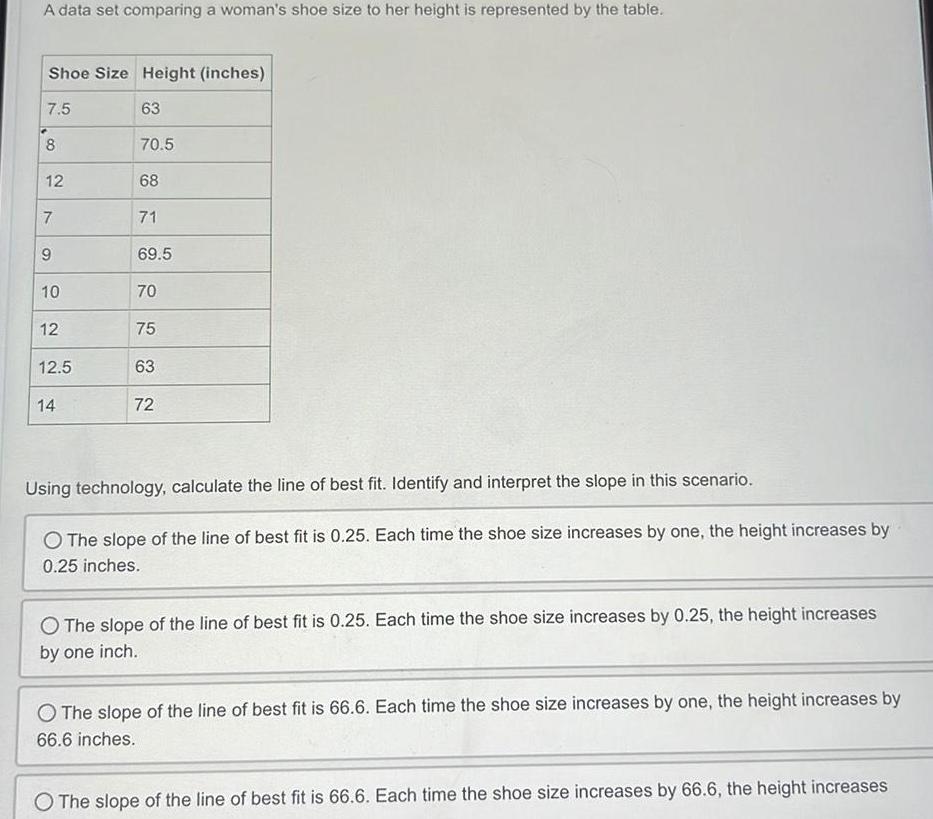
A data set comparing a woman s shoe size to her height is represented by the table Shoe Size Height inches 7 5 8 12 7 9 10 12 12 5 14 63 70 5 68 71 69 5 70 75 63 72 Using technology calculate the line of best fit Identify and interpret the slope in this scenario O The slope of the line of best fit is 0 25 Each time the shoe size increases by one the height increases by 0 25 inches O The slope of the line of best fit is 0 25 Each time the shoe size increases by 0 25 the height increases by one inch O The slope of the line of best fit is 66 6 Each time the shoe size increases by one the height increases by 66 6 inches O The slope of the line of best fit is 66 6 Each time the shoe size increases by 66 6 the height increases
Other questions asked by students
A sample of HR managers were selected to examine whether they expect job seekers of different...
Play Time Had A Small But Real Effect The researchers said they found the actual...
Generation Generation 5 Generation 10 Generation 20 The figure above shows plates made from a...
Endocrine System Explain the functions of the organ system List and explain the major organs...
A particle moving in a straight line covers first half of the distance into two...
9 p figure In the triangle above the cosine of p is 0 8 What...
In case the ball doesn't reach Martice, in the previous problem, Coach Kelly will place...
Corporations can buy back stock for treasury at any price they want. A.True B.False
The Grass is Greener Company provides $6,000 worth of services to customers on account during...
On the last day of the period, Jim Otto Company buys a $900 machine on...