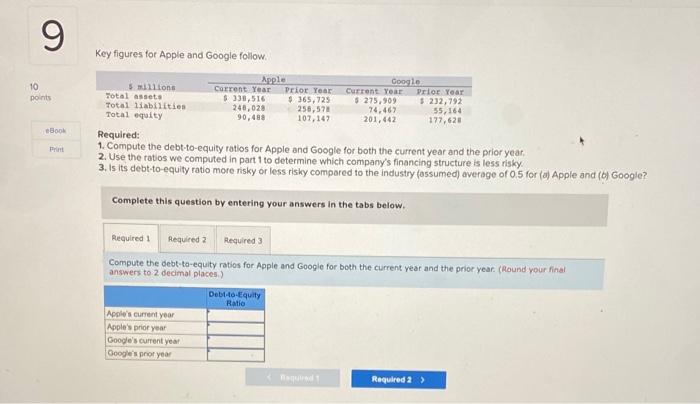
9 10 points Key figures for Apple and Google follow. Apple Google 5 millions Corrent...
80.2K
Verified Solution
Link Copied!
Question
Accounting
9 10 points Key figures for Apple and Google follow. Apple Google 5 millions Corrent Year Prior Year Current Year Prior Year Total assets $ 330,516 $365,725 $ 275,909 $ 232,792 Total liabilities 240,020 258,57 74.467 55,164 Total equity 90,488 107,147 201,442 177,620 Required: 1. Compute the debt-to-equity ratios for Apple and Google for both the current year and the prior year, 2. Use the ratios we computed in part 1 to determine which company's financing structure is less risky 3. Is its debt-to-equity ratio more risky or less risky compared to the industry (assumed) average of 0.5 for (a) Apple and (by Google? Print Complete this question by entering your answers in the tabs below. Required 1 Required 2 Required 3 Compute the debt-to-equity ratios for Apple and Google for both the current year and the prior year. (Round your final answers to 2 decimal places) Debt-to-Equity Ratio Apple's current year Apple's prior year Google's current year Google's por year aque Required 2 )
Answer & Explanation
Solved by verified expert
Get Answers to Unlimited Questions
Join us to gain access to millions of questions and expert answers. Enjoy exclusive benefits tailored just for you!
Membership Benefits:
Unlimited Question Access with detailed Answers
Zin AI - 3 Million Words
10 Dall-E 3 Images
20 Plot Generations
Conversation with Dialogue Memory
No Ads, Ever!
Access to Our Best AI Platform: Zin AI - Your personal assistant for all your inquiries!