6. Abbey Taylor, CFA, has been directed to determine the value of Sundanci's stock using...
50.1K
Verified Solution
Link Copied!
Question
Finance
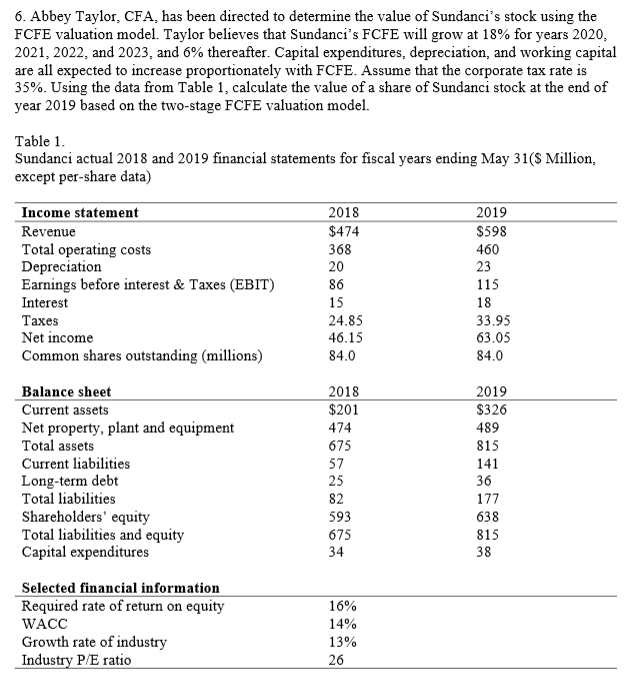
6. Abbey Taylor, CFA, has been directed to determine the value of Sundanci's stock using the FCFE valuation model. Taylor believes that Sundanci's FCFE will grow at 18% for years 2020, 2021, 2022, and 2023, and 6% thereafter. Capital expenditures, depreciation, and working capital are all expected to increase proportionately with FCFE. Assume that the corporate tax rate is 35%. Using the data from Table 1, calculate the value of a share of Sundanci stock at the end of year 2019 based on the two-stage FCFE valuation model. Table 1. Sundanci actual 2018 and 2019 financial statements for fiscal years ending May 31(5 Million, except per-share data) 2018 $474 368 Income statement Revenue Total operating costs Depreciation Earnings before interest & Taxes (EBIT) Interest Taxes Net income Common shares outstanding (millions) 2019 $598 460 23 115 18 33.95 24.85 46.15 84.0 63.05 84.0 2018 $201 474 2019 $326 489 815 141 675 Balance sheet Current assets Net property, plant and equipment Total assets Current liabilities Long-term debt Total liabilities Shareholders' equity Total liabilities and equity Capital expenditures 36 uo 38 Selected financial information Required rate of return on equity WACC Growth rate of industry Industry P/E ratio 16% 14% 13% 26 6. Abbey Taylor, CFA, has been directed to determine the value of Sundanci's stock using the FCFE valuation model. Taylor believes that Sundanci's FCFE will grow at 18% for years 2020, 2021, 2022, and 2023, and 6% thereafter. Capital expenditures, depreciation, and working capital are all expected to increase proportionately with FCFE. Assume that the corporate tax rate is 35%. Using the data from Table 1, calculate the value of a share of Sundanci stock at the end of year 2019 based on the two-stage FCFE valuation model. Table 1. Sundanci actual 2018 and 2019 financial statements for fiscal years ending May 31(5 Million, except per-share data) 2018 $474 368 Income statement Revenue Total operating costs Depreciation Earnings before interest & Taxes (EBIT) Interest Taxes Net income Common shares outstanding (millions) 2019 $598 460 23 115 18 33.95 24.85 46.15 84.0 63.05 84.0 2018 $201 474 2019 $326 489 815 141 675 Balance sheet Current assets Net property, plant and equipment Total assets Current liabilities Long-term debt Total liabilities Shareholders' equity Total liabilities and equity Capital expenditures 36 uo 38 Selected financial information Required rate of return on equity WACC Growth rate of industry Industry P/E ratio 16% 14% 13% 26
Answer & Explanation
Solved by verified expert
Get Answers to Unlimited Questions
Join us to gain access to millions of questions and expert answers. Enjoy exclusive benefits tailored just for you!
Membership Benefits:
Unlimited Question Access with detailed Answers
Zin AI - 3 Million Words
10 Dall-E 3 Images
20 Plot Generations
Conversation with Dialogue Memory
No Ads, Ever!
Access to Our Best AI Platform: Zin AI - Your personal assistant for all your inquiries!