4. Table 3.1 in the last chapter presents R&E Supplies' financial statements for the period...
50.1K
Verified Solution
Link Copied!
Question
Finance
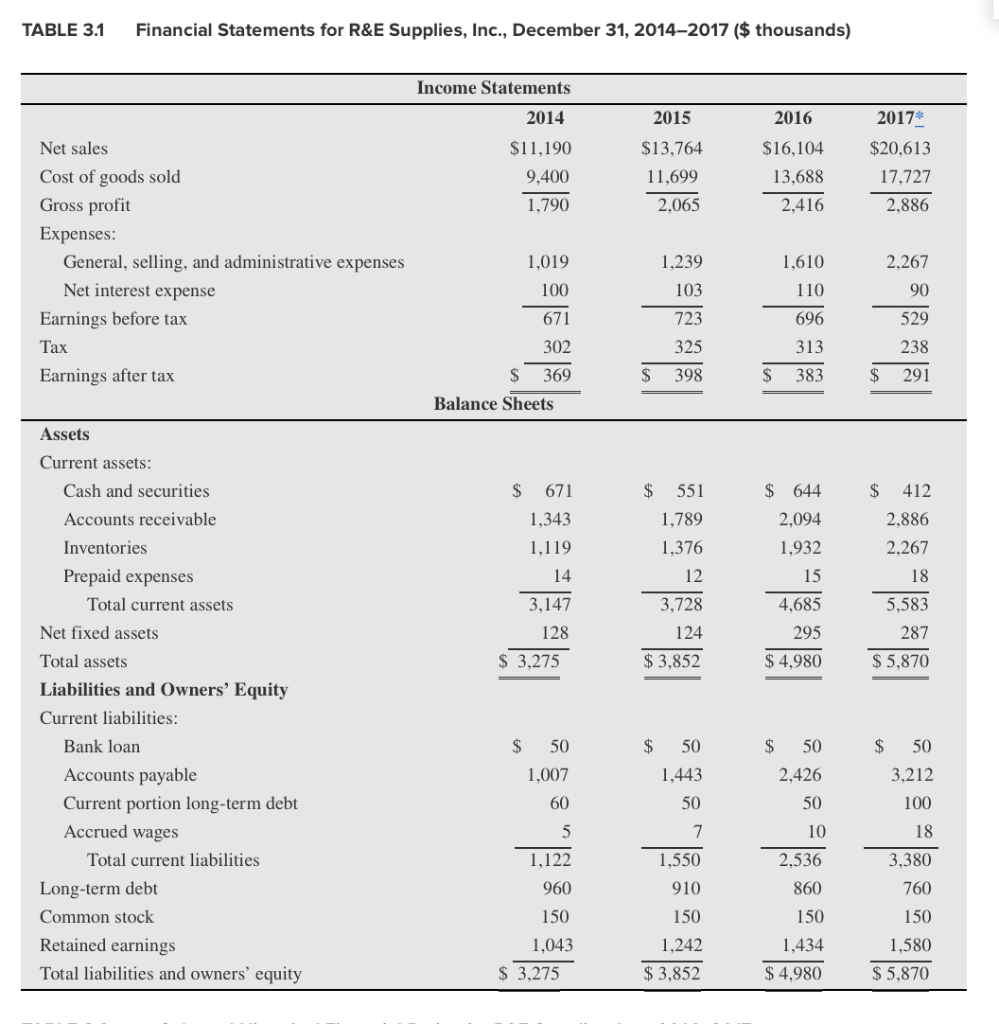
4. Table 3.1 in the last chapter presents R&E Supplies' financial statements for the period 2014 through 2017, and Table 3.5 @ presents a pro forma financial forecast for 2018. Use the information in these tables to answer the following questions. a. Calculate R&E's sustainable growth rate in each year from 2015 through 2018. b. Comparing the company's sustainable growth rate with its actual and projected growth rates in sales over these years, what growth management problems does R&E appear to face in this period? c. How did the company cope with these problems? Do you see any difficulties with the way it addressed its growth problems over this period? If so, what are they? d. What advice would you offer management regarding managing future growth? TABLE 3.1 Financial Statements for R&E Supplies, Inc., December 31, 2014-2017 ($ thousands) Income Statements 2014 2015 2016 2017 $11,190 9,400 1,790 $13,764 11,699 2,065 $16,104 13,688 2.416 $20,613 17,727 2.886 Net sales Cost of goods sold Gross profit Expenses: General, selling, and administrative expenses Net interest expense Earnings before tax Tax Earnings after tax 1.239 2,267 1,019 100 671 1,610 110 103 90 529 723 325 696 313 302 $ 369 Balance Sheets 238 291 $ 398 S 383 $ $ 671 $ 551 $ 644 1,343 1,119 1,789 1,376 2,094 1,932 15 14 12 $ 412 2,886 2,267 18 5,583 287 $ 5,870 3,147 128 $ 3,275 $ 3215 3,728 124 $ 3,852 4,685 295 $ 4,980 Assets Current assets: Cash and securities Accounts receivable Inventories Prepaid expenses Total current assets Net fixed assets Total assets Liabilities and Owners' Equity Current liabilities: Bank loan Accounts payable Current portion long-term debt Accrued wages Total current liabilities Long-term debt Common stock Retained earnings Total liabilities and owners' equity $ 50 $ 50 $ 50 $ 50 1,007 1,443 3,212 2,426 50 60 50 100 5 7 10 18 2,536 1,122 960 150 1,043 $ 3.275 1,550 910 150 860 150 3,380 760 150 1,580 $ 5,870 1.242 $ 3,852 1,434 $ 4,980 TABLE 3.5 Forecasting with a Spreadsheet: Pro Forma Financial Forecast for R&E Supplies, Inc., December 31, 2018 ($ thousands) A B D 1 1 2 Year 2018 2019 2017 Actual $20,613 25.0% 86.0% $ 760 $ 100 3 Net sales 4 Growth rate in net sales 5 Cost of goods soldet sales 6 Gen., sell., and admin. expenseset sales 7 Long-term debt 8 Current portion long-term debt 9 Interest rate 10 Tax rate 11 Dividend/earnings after tax 12 Current assetset sales 13 Net fixed assets 14 Current liabilitieset sales 15 Owners' equity 16 INCOME STATEMENT 12.0% $660 $100 10.0% 45.0% 50.0% 29.0% $280 14.5% $ 1,730 17 Forecast Forecast Equations 2018 2019 2018 $25,766 22,159 3,607 =B3 + B3 * C4 = C5 * C19 = C19-C20 = C6 * C19 = C9 * (C7 + C8 + C40) = C21 - C22-C23 = C10* C24 = C24 - C25 = C11* C26 = C26 - C27 3,092 231 285 128 156 78 78 18 Year 19 Net sales 20 Cost of goods sold 21 Gross profit 22 Gen., sell, and admin. exp. 23 | Interest expense 24 Earnings before tax 25 | Tax 26 | Earnings after tax 27 Dividends paid 28 Additions to retained earnings 29 30 | BALANCE SHEET 31 | Current assets 32 Net fixed assets 33 Total assets 34 35 | Current liabilities 36 Long-term debt 37 Owners' equity 38 Total liabilities and owners' 39 equity 40 EXTERNAL FUNDING REQUIRED 7,472 = C12* C19 = C13 = C31 + C32 = 280 7,752 = C14* C19 = C7 = B15 + C28 = C35 + C36 + C37 3,736 660 1,808 6,204 =C33-C38 $ 1,548 4. Table 3.1 in the last chapter presents R&E Supplies' financial statements for the period 2014 through 2017, and Table 3.5 @ presents a pro forma financial forecast for 2018. Use the information in these tables to answer the following questions. a. Calculate R&E's sustainable growth rate in each year from 2015 through 2018. b. Comparing the company's sustainable growth rate with its actual and projected growth rates in sales over these years, what growth management problems does R&E appear to face in this period? c. How did the company cope with these problems? Do you see any difficulties with the way it addressed its growth problems over this period? If so, what are they? d. What advice would you offer management regarding managing future growth? TABLE 3.1 Financial Statements for R&E Supplies, Inc., December 31, 2014-2017 ($ thousands) Income Statements 2014 2015 2016 2017 $11,190 9,400 1,790 $13,764 11,699 2,065 $16,104 13,688 2.416 $20,613 17,727 2.886 Net sales Cost of goods sold Gross profit Expenses: General, selling, and administrative expenses Net interest expense Earnings before tax Tax Earnings after tax 1.239 2,267 1,019 100 671 1,610 110 103 90 529 723 325 696 313 302 $ 369 Balance Sheets 238 291 $ 398 S 383 $ $ 671 $ 551 $ 644 1,343 1,119 1,789 1,376 2,094 1,932 15 14 12 $ 412 2,886 2,267 18 5,583 287 $ 5,870 3,147 128 $ 3,275 $ 3215 3,728 124 $ 3,852 4,685 295 $ 4,980 Assets Current assets: Cash and securities Accounts receivable Inventories Prepaid expenses Total current assets Net fixed assets Total assets Liabilities and Owners' Equity Current liabilities: Bank loan Accounts payable Current portion long-term debt Accrued wages Total current liabilities Long-term debt Common stock Retained earnings Total liabilities and owners' equity $ 50 $ 50 $ 50 $ 50 1,007 1,443 3,212 2,426 50 60 50 100 5 7 10 18 2,536 1,122 960 150 1,043 $ 3.275 1,550 910 150 860 150 3,380 760 150 1,580 $ 5,870 1.242 $ 3,852 1,434 $ 4,980 TABLE 3.5 Forecasting with a Spreadsheet: Pro Forma Financial Forecast for R&E Supplies, Inc., December 31, 2018 ($ thousands) A B D 1 1 2 Year 2018 2019 2017 Actual $20,613 25.0% 86.0% $ 760 $ 100 3 Net sales 4 Growth rate in net sales 5 Cost of goods soldet sales 6 Gen., sell., and admin. expenseset sales 7 Long-term debt 8 Current portion long-term debt 9 Interest rate 10 Tax rate 11 Dividend/earnings after tax 12 Current assetset sales 13 Net fixed assets 14 Current liabilitieset sales 15 Owners' equity 16 INCOME STATEMENT 12.0% $660 $100 10.0% 45.0% 50.0% 29.0% $280 14.5% $ 1,730 17 Forecast Forecast Equations 2018 2019 2018 $25,766 22,159 3,607 =B3 + B3 * C4 = C5 * C19 = C19-C20 = C6 * C19 = C9 * (C7 + C8 + C40) = C21 - C22-C23 = C10* C24 = C24 - C25 = C11* C26 = C26 - C27 3,092 231 285 128 156 78 78 18 Year 19 Net sales 20 Cost of goods sold 21 Gross profit 22 Gen., sell, and admin. exp. 23 | Interest expense 24 Earnings before tax 25 | Tax 26 | Earnings after tax 27 Dividends paid 28 Additions to retained earnings 29 30 | BALANCE SHEET 31 | Current assets 32 Net fixed assets 33 Total assets 34 35 | Current liabilities 36 Long-term debt 37 Owners' equity 38 Total liabilities and owners' 39 equity 40 EXTERNAL FUNDING REQUIRED 7,472 = C12* C19 = C13 = C31 + C32 = 280 7,752 = C14* C19 = C7 = B15 + C28 = C35 + C36 + C37 3,736 660 1,808 6,204 =C33-C38 $ 1,548
Answer & Explanation
Solved by verified expert
Get Answers to Unlimited Questions
Join us to gain access to millions of questions and expert answers. Enjoy exclusive benefits tailored just for you!
Membership Benefits:
Unlimited Question Access with detailed Answers
Zin AI - 3 Million Words
10 Dall-E 3 Images
20 Plot Generations
Conversation with Dialogue Memory
No Ads, Ever!
Access to Our Best AI Platform: Zin AI - Your personal assistant for all your inquiries!