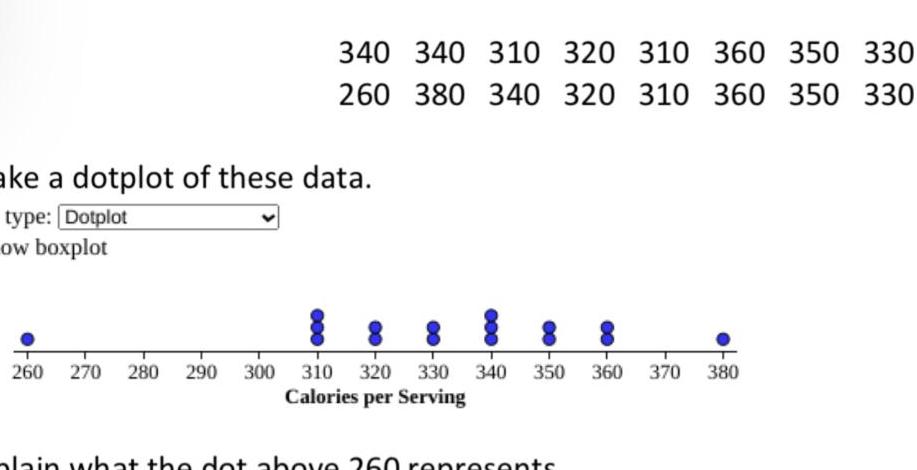
340 340 310 320 310 360 350 330 260 380 340 320 310 360 350 330 ake a dotplot of these data type Dotplot ow boxplot 260 270 280 290 300 310 320 330 340 350 360 370 Calories per Serving alain what the dot above 260 represents 380
Join us to gain access to millions of questions and expert answers. Enjoy exclusive benefits tailored just for you!
(Save $1 )
One time Pay
(Save $5 )
Billed Monthly
*First month only
You can see the logs in the Dashboard.