1.Table 1 indicates that Firm Ms net contribution is the lowest in the industry. Using...
60.1K
Verified Solution
Link Copied!
Question
Accounting
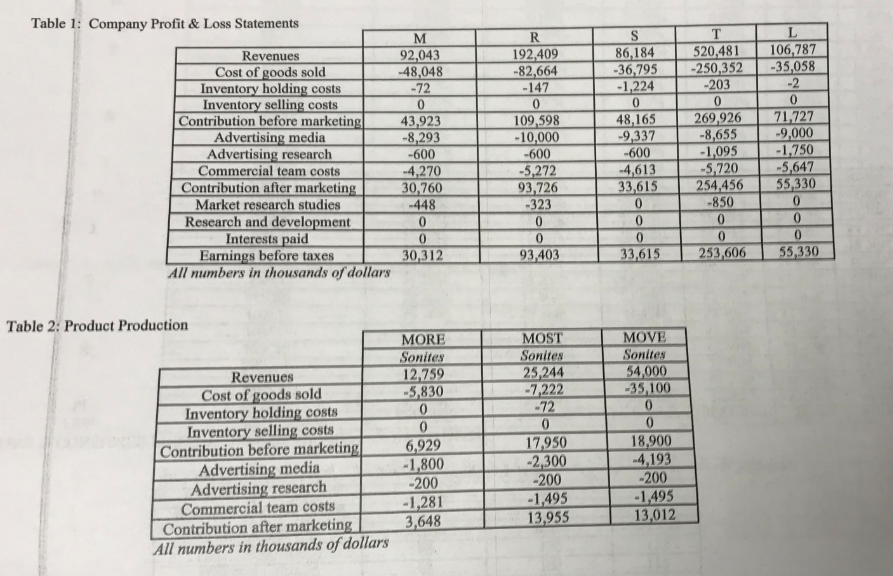
1.Table 1 indicates that Firm Ms net contribution is the lowest in the industry. Using the information provided in Table 1 to Table 7 ONLY, explain the reasons for its poor profitability.
2. Given all the data provided in the tables, how many units of product MOVE would you recommended Firm M to produce in the next period?Justify your recommendation by showing all of your analyses.
Table 1: Company Profit& Loss Statements 92,043 48,048 72 192,409 82,664 -147 86,184 520,481 106787 -250.352 -35,058 36,795 1,224 Cost of goods sold 203 Inventory selling costs Contribution before marketin Advertising media Advertising research Commercial team costs Contribution after marketing Market research studies Research and development Interests paid Earnings before taxes 48,165 43,923 8,293 109598 -10,000 8,655 -1,095 9,000 -1,750 4,270 30,760 -448 4,613 33,615 254 456 55,330 93,726 -323 850 33,015 253.6061-55330 55,330 30,312 93,403 All numbers in thousands of dollars Table 2: Product Production MOVE Sonites 4,000 Sonites 12.759 -5,830 Sonites 25,244 7222 0 17,950 Revenues Cost of goods sold Inventory holding costs Inventory selling costs Contribution before marketing Advertising media Advertising research Commercial team costs Contribution after marketing -35,100 6,929 4,193 -200 200 -1,281 3,648 -1,495 13,955 13,012 All numbers in thousands of dollars
Answer & Explanation
Solved by verified expert
Get Answers to Unlimited Questions
Join us to gain access to millions of questions and expert answers. Enjoy exclusive benefits tailored just for you!
Membership Benefits:
Unlimited Question Access with detailed Answers
Zin AI - 3 Million Words
10 Dall-E 3 Images
20 Plot Generations
Conversation with Dialogue Memory
No Ads, Ever!
Access to Our Best AI Platform: Zin AI - Your personal assistant for all your inquiries!