11 A graph regarding photo electric effect is shown between the maximum kinetic energy of...
60.1K
Verified Solution
Link Copied!
Question
Physics
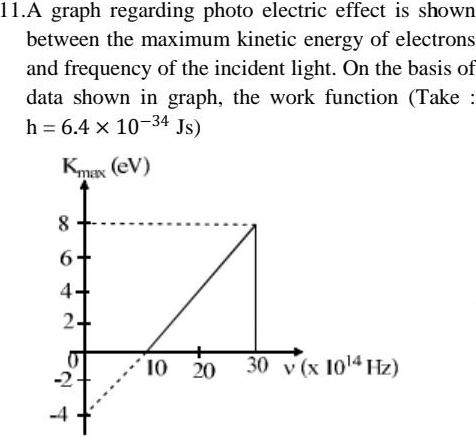
11 A graph regarding photo electric effect is shown between the maximum kinetic energy of electrons and frequency of the incident light On the basis of data shown in graph the work function Take h 6 4 x 10 34 Js Kmax ev 8 4 2 2 T 10 20 30 x 10 4 Hz
Answer & Explanation
Solved by verified expert
Get Answers to Unlimited Questions
Join us to gain access to millions of questions and expert answers. Enjoy exclusive benefits tailored just for you!
Membership Benefits:
Unlimited Question Access with detailed Answers
Zin AI - 3 Million Words
10 Dall-E 3 Images
20 Plot Generations
Conversation with Dialogue Memory
No Ads, Ever!
Access to Our Best AI Platform: Zin AI - Your personal assistant for all your inquiries!