1 INAME 3 Cheryl Johnson, the director of marketing for the Thingamaig Company, has 4...
90.2K
Verified Solution
Link Copied!
Question
Finance
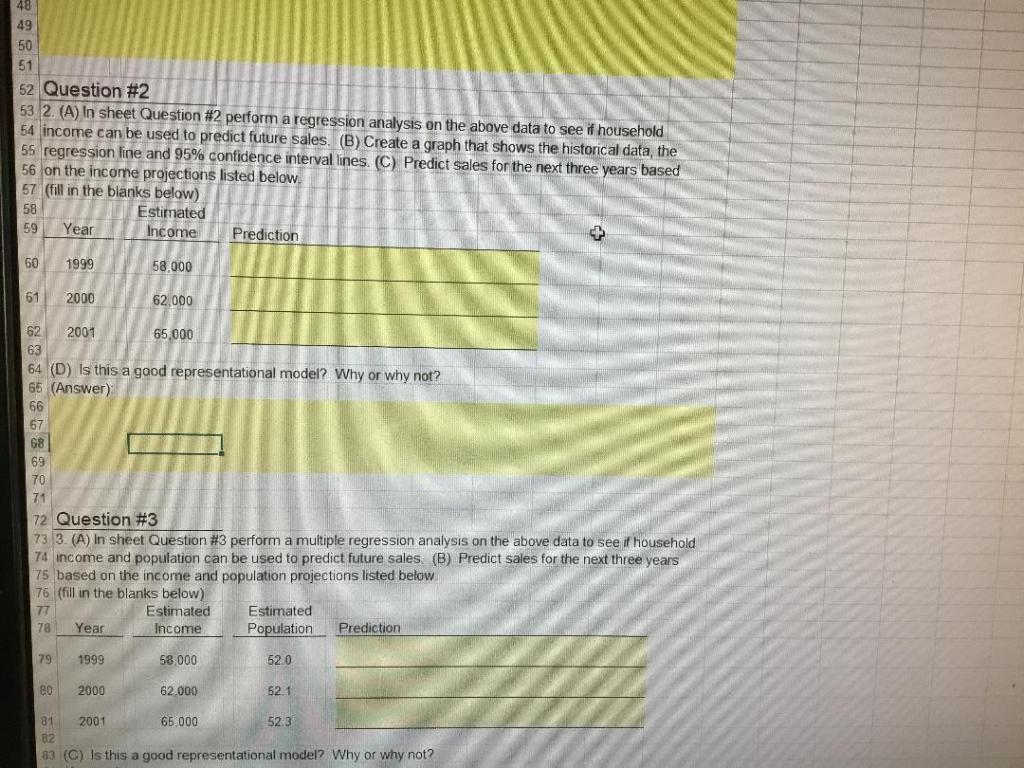
1 INAME 3 Cheryl Johnson, the director of marketing for the Thingamaig Company, has 4 collected data on the annual number of households in the state, the adjusted average 5 annual household income, and Thingamajig's sales of widgets. She would like you to 6 analyze these data for developing a forecast of future widget sales Number of HouseholdsIn Average HouseholdWidgets 10 Year 11 1980 12 1981 13 1982 14 1983 15 1984 161985 17 1986 18 1987 19 1988 20 1989 21 1990 22 1991 23 1992 24 1993 25 1994 261995 27 1996 28 1997 29 1998 Income 34,000 34,600 41,000 38,000 Sold 5,500 5,600 5,900 5,800 6,100 6,900 6,300 39.5 40. 43.1 43 2 42,000 44,000 46.2 46.5 6,700 6,900 7,200 7.100 7.100 46,000 51,000 48.000 47,000 50,000 51,000 53.000 54,000 55,000 53,000 47.3 7,600 7.900 7,300 8,000 48.0 48.1 30 31 Question #1 321 (A) in sheet Question #1,Perform a regression analysis on the above data to see if the 33 population can be used to predict future sales, (B) Create a graph that shows the historical data, the 34 regression line and 95% confidence interval lines. (C) Predict sales for the next three years based 35 on the population projections listed belovw 36 (fill in the blanks below) 37 38 Year Population Prediction Estimatecd 39 1999 40 2000 52.1 48 49 50 51 52 Question #2 53 | 2 (A) In sheet Question #2 perform a regression analysis on the above data to see if household 54 income can be used to predict future sales. (B) Create a graph that shows the historical data, the regression line and 95% confidence interval lines. 56 on the income projections listed below. 57 (fill in the blanks below) C Predict sales for the next three years based Estimated 59 Year Income Prediction 1999 58.000 62,000 65,000 58,000 61 2000 62 2001 63 64 (D) Is this a good representational model? Why or why not? 65 (Answer 67 68 69 70 72 Question #3 see o e d 3. A n sheet Question #3 perform amultiple regression analysis on the ab veda a 74 income and population can be used to predict future sales, (B) Predict sales for the next three years 75 based on the income and population projections listed below 76 (fill in the blanks below) 78 Year 79 1999 80 2000 81 2001 Estimated Population Prediction Estimated Income 58,000 62,000 65,000 52.0 52.1 52.3 82 3 (C) Is this a good representational model? Why or why not? 1 INAME 3 Cheryl Johnson, the director of marketing for the Thingamaig Company, has 4 collected data on the annual number of households in the state, the adjusted average 5 annual household income, and Thingamajig's sales of widgets. She would like you to 6 analyze these data for developing a forecast of future widget sales Number of HouseholdsIn Average HouseholdWidgets 10 Year 11 1980 12 1981 13 1982 14 1983 15 1984 161985 17 1986 18 1987 19 1988 20 1989 21 1990 22 1991 23 1992 24 1993 25 1994 261995 27 1996 28 1997 29 1998 Income 34,000 34,600 41,000 38,000 Sold 5,500 5,600 5,900 5,800 6,100 6,900 6,300 39.5 40. 43.1 43 2 42,000 44,000 46.2 46.5 6,700 6,900 7,200 7.100 7.100 46,000 51,000 48.000 47,000 50,000 51,000 53.000 54,000 55,000 53,000 47.3 7,600 7.900 7,300 8,000 48.0 48.1 30 31 Question #1 321 (A) in sheet Question #1,Perform a regression analysis on the above data to see if the 33 population can be used to predict future sales, (B) Create a graph that shows the historical data, the 34 regression line and 95% confidence interval lines. (C) Predict sales for the next three years based 35 on the population projections listed belovw 36 (fill in the blanks below) 37 38 Year Population Prediction Estimatecd 39 1999 40 2000 52.1 48 49 50 51 52 Question #2 53 | 2 (A) In sheet Question #2 perform a regression analysis on the above data to see if household 54 income can be used to predict future sales. (B) Create a graph that shows the historical data, the regression line and 95% confidence interval lines. 56 on the income projections listed below. 57 (fill in the blanks below) C Predict sales for the next three years based Estimated 59 Year Income Prediction 1999 58.000 62,000 65,000 58,000 61 2000 62 2001 63 64 (D) Is this a good representational model? Why or why not? 65 (Answer 67 68 69 70 72 Question #3 see o e d 3. A n sheet Question #3 perform amultiple regression analysis on the ab veda a 74 income and population can be used to predict future sales, (B) Predict sales for the next three years 75 based on the income and population projections listed below 76 (fill in the blanks below) 78 Year 79 1999 80 2000 81 2001 Estimated Population Prediction Estimated Income 58,000 62,000 65,000 52.0 52.1 52.3 82 3 (C) Is this a good representational model? Why or why not
Answer & Explanation
Solved by verified expert
Get Answers to Unlimited Questions
Join us to gain access to millions of questions and expert answers. Enjoy exclusive benefits tailored just for you!
Membership Benefits:
Unlimited Question Access with detailed Answers
Zin AI - 3 Million Words
10 Dall-E 3 Images
20 Plot Generations
Conversation with Dialogue Memory
No Ads, Ever!
Access to Our Best AI Platform: Zin AI - Your personal assistant for all your inquiries!